

What can we know about the cost of Brexit so far?
- Disentangling the economic effects of Brexit and Covid-19 is difficult. But now that most advanced economies have surpassed their pre-pandemic level of output, we have a basis of comparison for the UK economy.
- As with my earlier modelling exercises, I construct ‘doppelgängers’ – each of them a basket of countries whose economic performance closely matches the UK’s before the Brexit referendum and the end of the transition period. They provide a counterfactual UK that did not leave the EU. I estimate doppelgängers for GDP, investment (gross fixed capital formation), total services trade (exports plus imports) and total goods trade (ditto).
- The results are sobering. In the final quarter of 2021, UK GDP is 5.2 per cent smaller than the modelled, doppelgänger UK; investment is 13.7 per cent lower; and goods trade, 13.6 per cent lower. The UK’s poor economic performance in the pandemic may be partly to blame for the weakness of GDP, but its early vaccination campaign meant its restrictions ended earlier than those of many peer economies. And over the period from the referendum to the pandemic, a sizeable shortfall – 2.9 per cent – had appeared between the UK and the doppelgänger. Investment also began to lag at the point of the referendum, and goods trade when the UK left the single market.
- The estimate for services trade is that the UK’s level is 7.9 per cent higher than that of the doppelgänger, but the estimate is not robust: for now, we cannot know what the impact of Brexit on services trade has been.
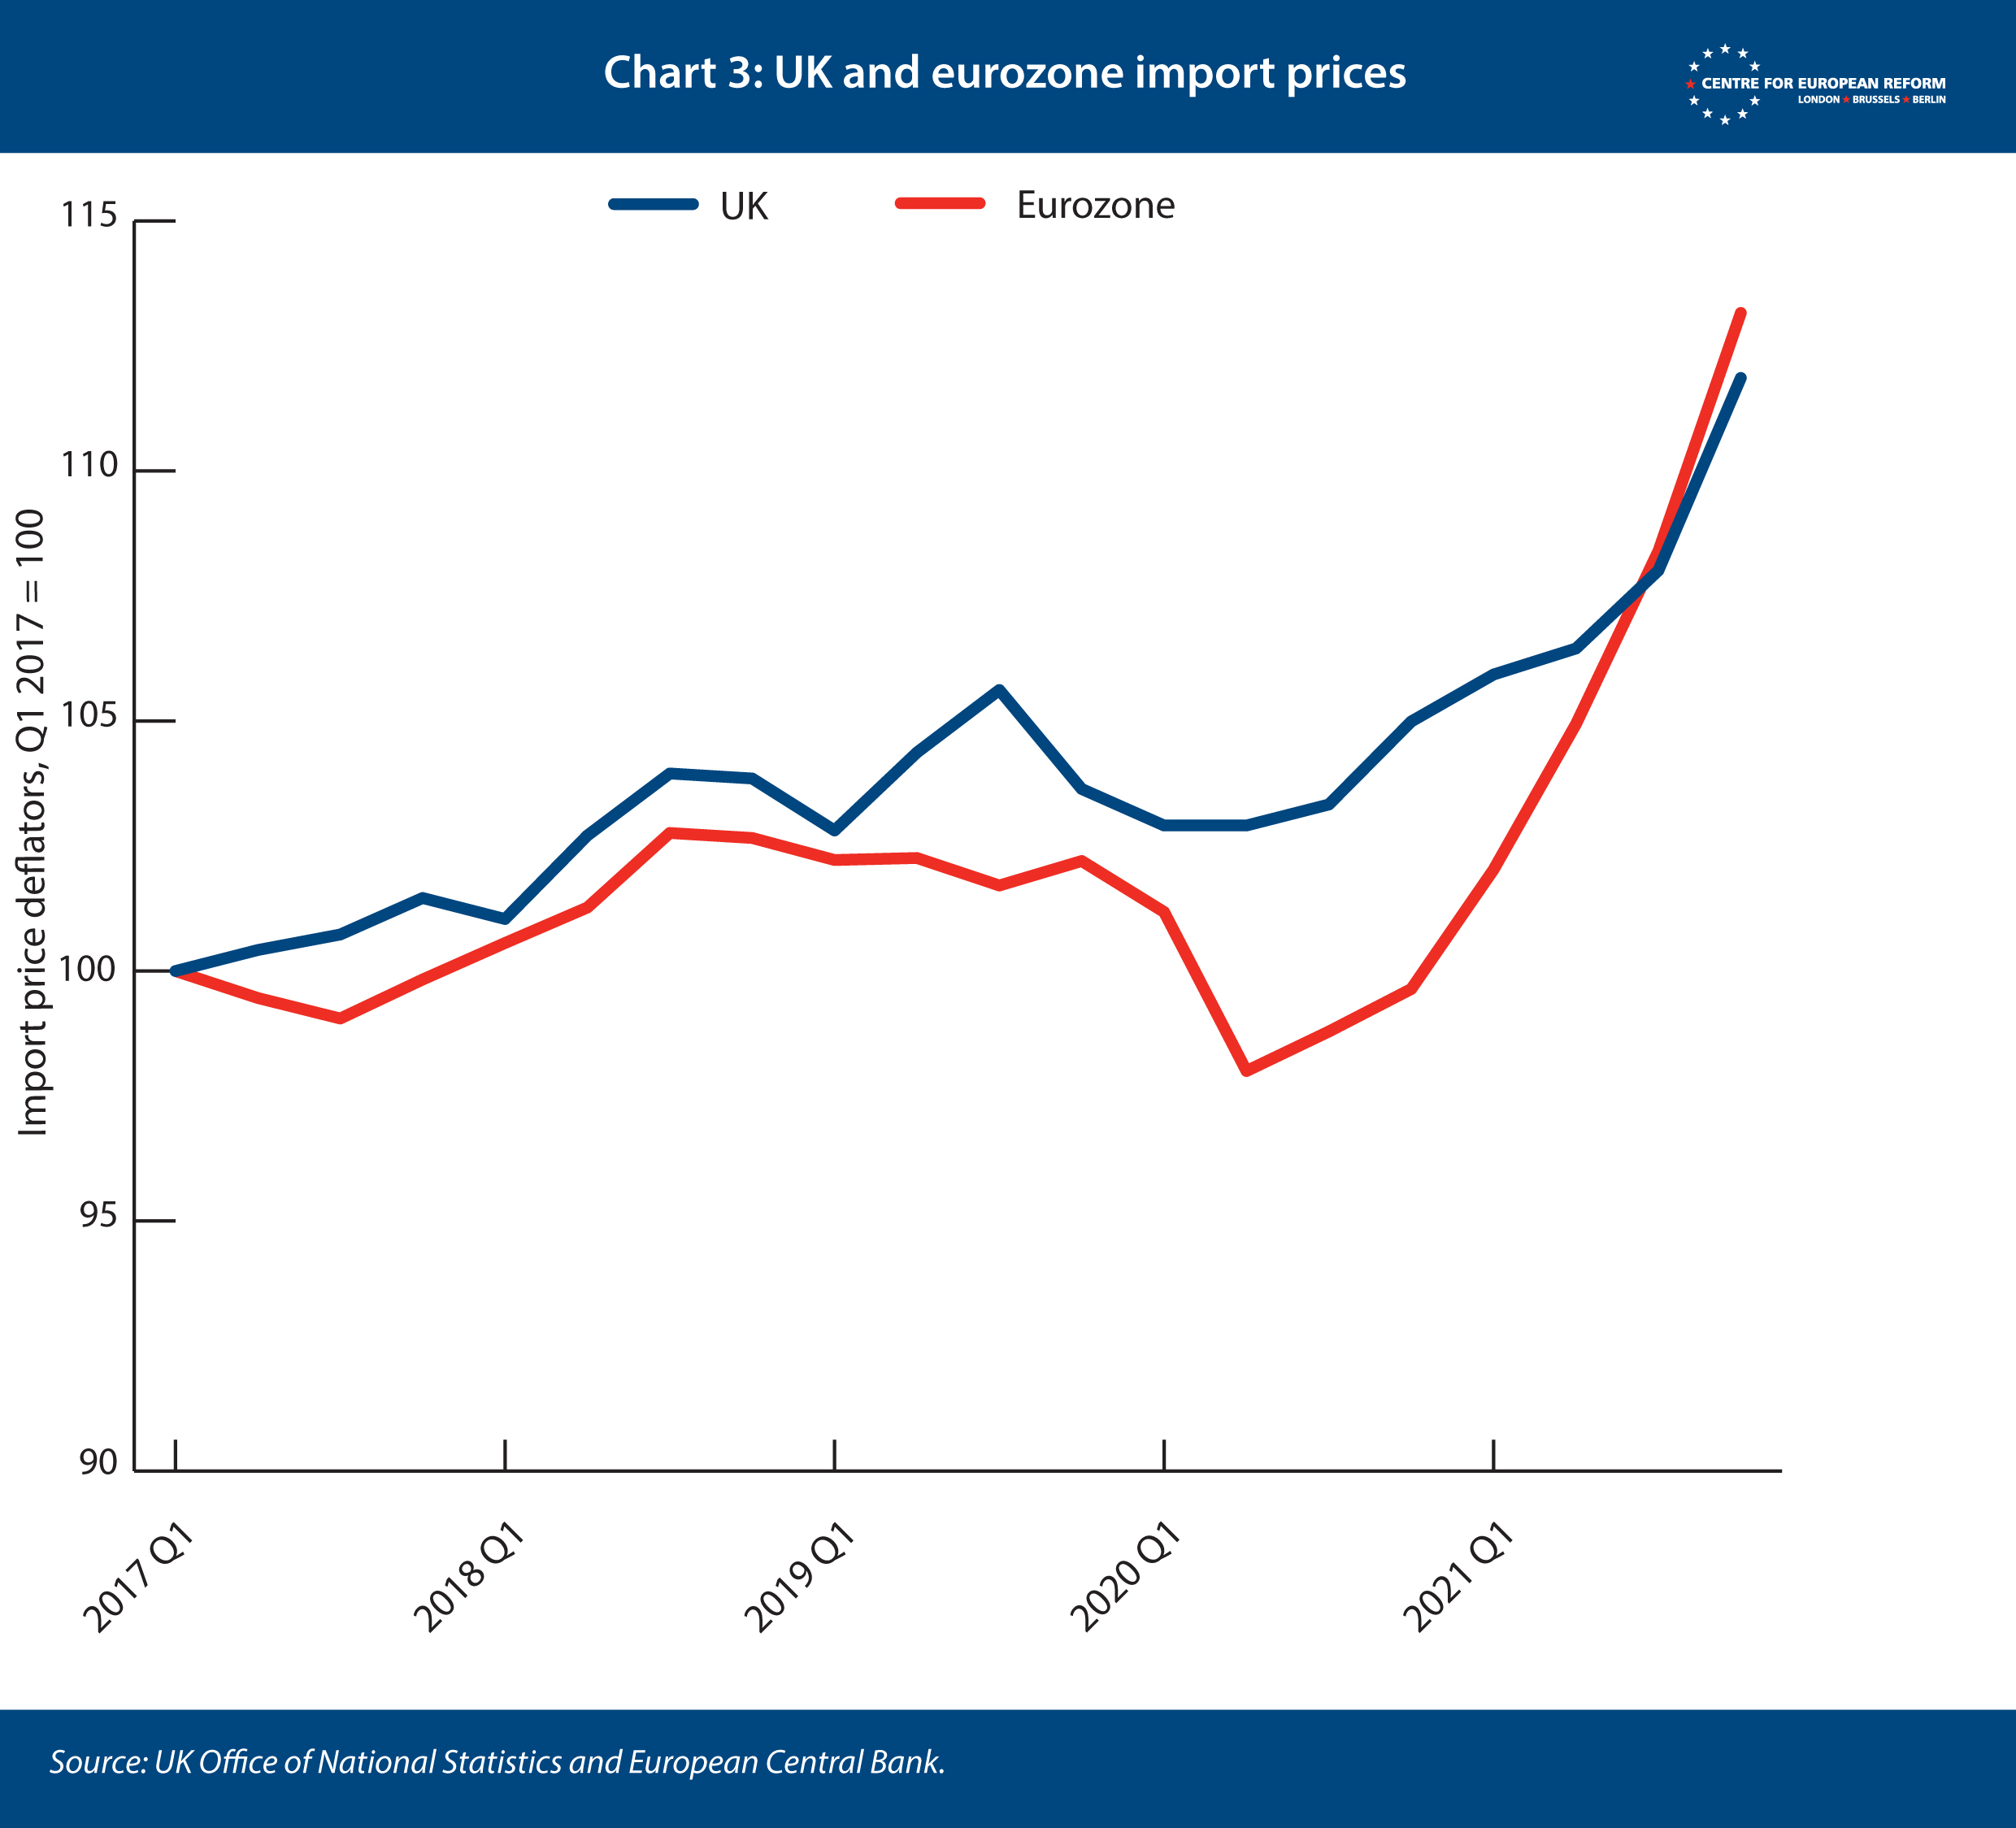
- The impact of Brexit on inflation is small in comparison to global price hikes in manufactured goods, energy and other commodities. The end of free movement has reduced labour supply, but the number of British workers becoming inactive over the pandemic has had a much larger effect. Import price inflation has been similar in the eurozone and the UK, despite the large decline in Britain’s goods imports from the EU after it left the single market and customs union.
- This is the backdrop – and one that is largely unmentioned in the UK political debate – for the big tax rises that the Chancellor has announced over the last year. A smaller economy means higher taxes are needed to fund public services and welfare. The Office for Budget Responsibility forecasts that the scarring effects of Brexit will be larger than those of Covid. Our own estimates are in accord with that view.
In May 2020, the well-connected journalist James Forsyth wrote in The Spectator that the British government was comfortable about Britain leaving the EU with no deal. That was because advisors thought that “coronavirus has collapsed world trade and travel, dwarfing any changes Brexit might bring.” As my series on the impact of Brexit on goods trade has shown, this turned out to be wrong: leaving the single market and customs union has reduced UK goods trade by around 15 per cent.1 Yet the government was right about one thing: the pandemic has made it hard to isolate the impact of Brexit on other economic indicators, like GDP, services trade or investment. Now that many advanced economies have recovered and are close to – or above – their pre-pandemic level of output, we can compare Britain’s economic performance to its peers. The results are troubling.
This policy brief provides doppelgänger estimates for the impact of Brexit – and the pandemic – on Britain’s GDP, on gross fixed capital formation (GFCF, a broad measure of investment across the economy), on services trade and on goods trade, for the last quarter of 2021. The estimates are shown in Chart 1. UK GDP is 5.2 per cent lower than that of the doppelgänger. Investment is 13.7 per cent lower; goods trade, 13.6 per cent lower; and services trade 7.9 per cent higher.

These estimates are based upon separate quarterly GDP, GFCF, services and goods trade models, which compare the UK’s performance to that of its peers up to the last quarter of 2021.
In each case, an algorithm compares data on the UK’s economic performance with that of 22 other advanced economies. It selects a subset of those countries and allocates each a weighting, to create a basket of countries that minimises the difference between their data and that of the UK. The algorithm matches the growth rate of real GDP, GFCF, services and goods trade, from Q1 2009, as well as the inflation rate, industrial production as a share of GDP, average years of schooling and other variables. We can then compare the performance of this doppelgänger against that of the UK.
The doppelgänger method is useful because it creates a counterfactual economy whose GDP growth and other variables are most similar to Britain’s before the referendum, based on the real economic performance of other countries. There is little point in comparing the UK to, for example, Japan or Italy, two countries with slower GDP growth rates, in part because their societies have been ageing more rapidly. The method is also better than comparing the size of the British economy now to an earlier point, such as immediately before the country’s exit from the single market and customs union. Brexit will tend to reduce growth over the medium term, rather than the level of GDP, so we are unlikely to see big immediate drops in activity that would constitute a smoking gun. Instead, we need peer economies for comparison. The doppelgänger method allows us to find the best set of peer economies to compare Britain to.
The structure of this policy brief is as follows: I discuss how robust my estimates for GDP, investment, services and goods trade are, and the extent to which we can point the finger at Brexit or Covid. I conclude with a discussion of the impact of Brexit on inflation. More information on the model, including source data and Stata code, is available in an appendix.
GDP
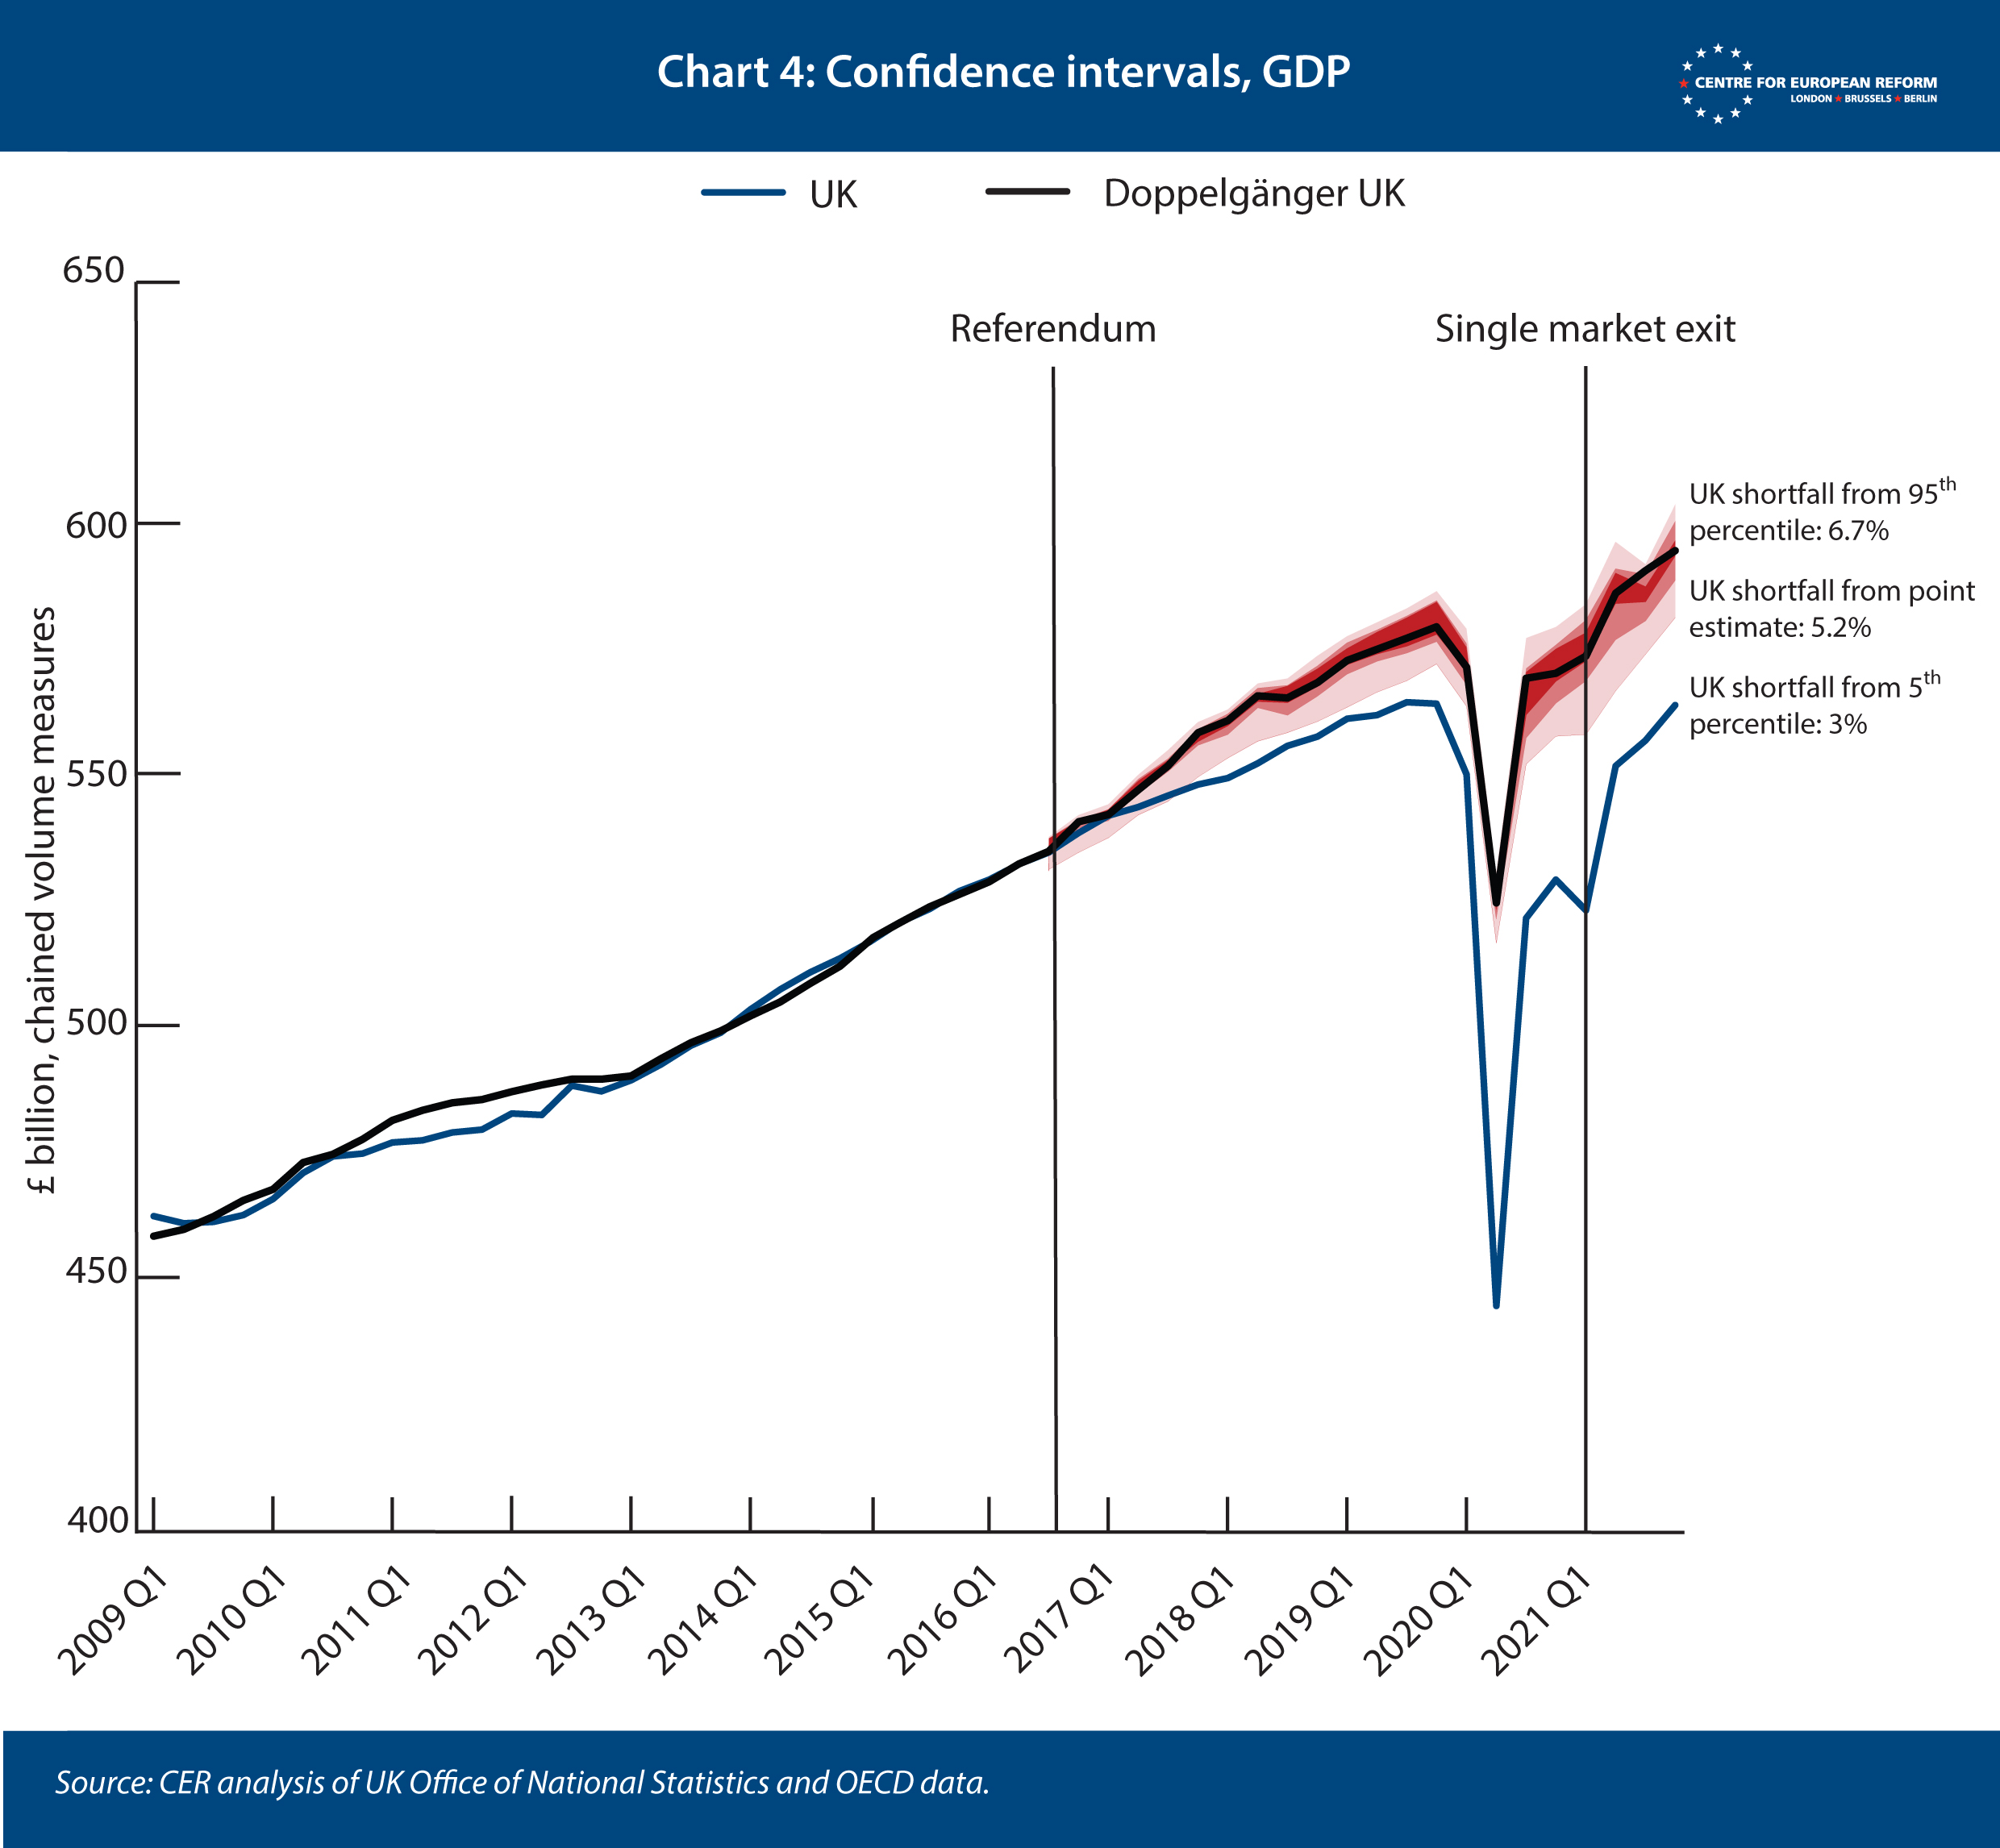
To estimate the impact on GDP, the algorithm finds the doppelgänger from Q1 2009 to Q2 2016 data (the quarter of the referendum). Chart 1 shows that the gap between Britain and the doppelgänger grew to 2.9 per cent by the fourth quarter of 2019, before the pandemic struck. The pandemic shrank Britain’s economy by far more than that of the doppelgänger, but the subsequent rebound narrowed the gap to 5.2 per cent, or £31 billion, by the end of 2021.
The doppelgänger is made up of the United States (31 per cent), Germany (15 per cent), New Zealand (14 per cent), Norway (8 per cent) and Australia (5 per cent). The remaining countries make up less than 5 per cent of the doppelgänger each. (See appendix for more details.)
We can test the estimate by comparing the UK to the average GDP performance of the 22 other advanced economies (as opposed to the smaller group of countries the algorithm selects to make up the doppelgänger). Chart 2 shows that the gap is very similar, at 4.9 per cent.
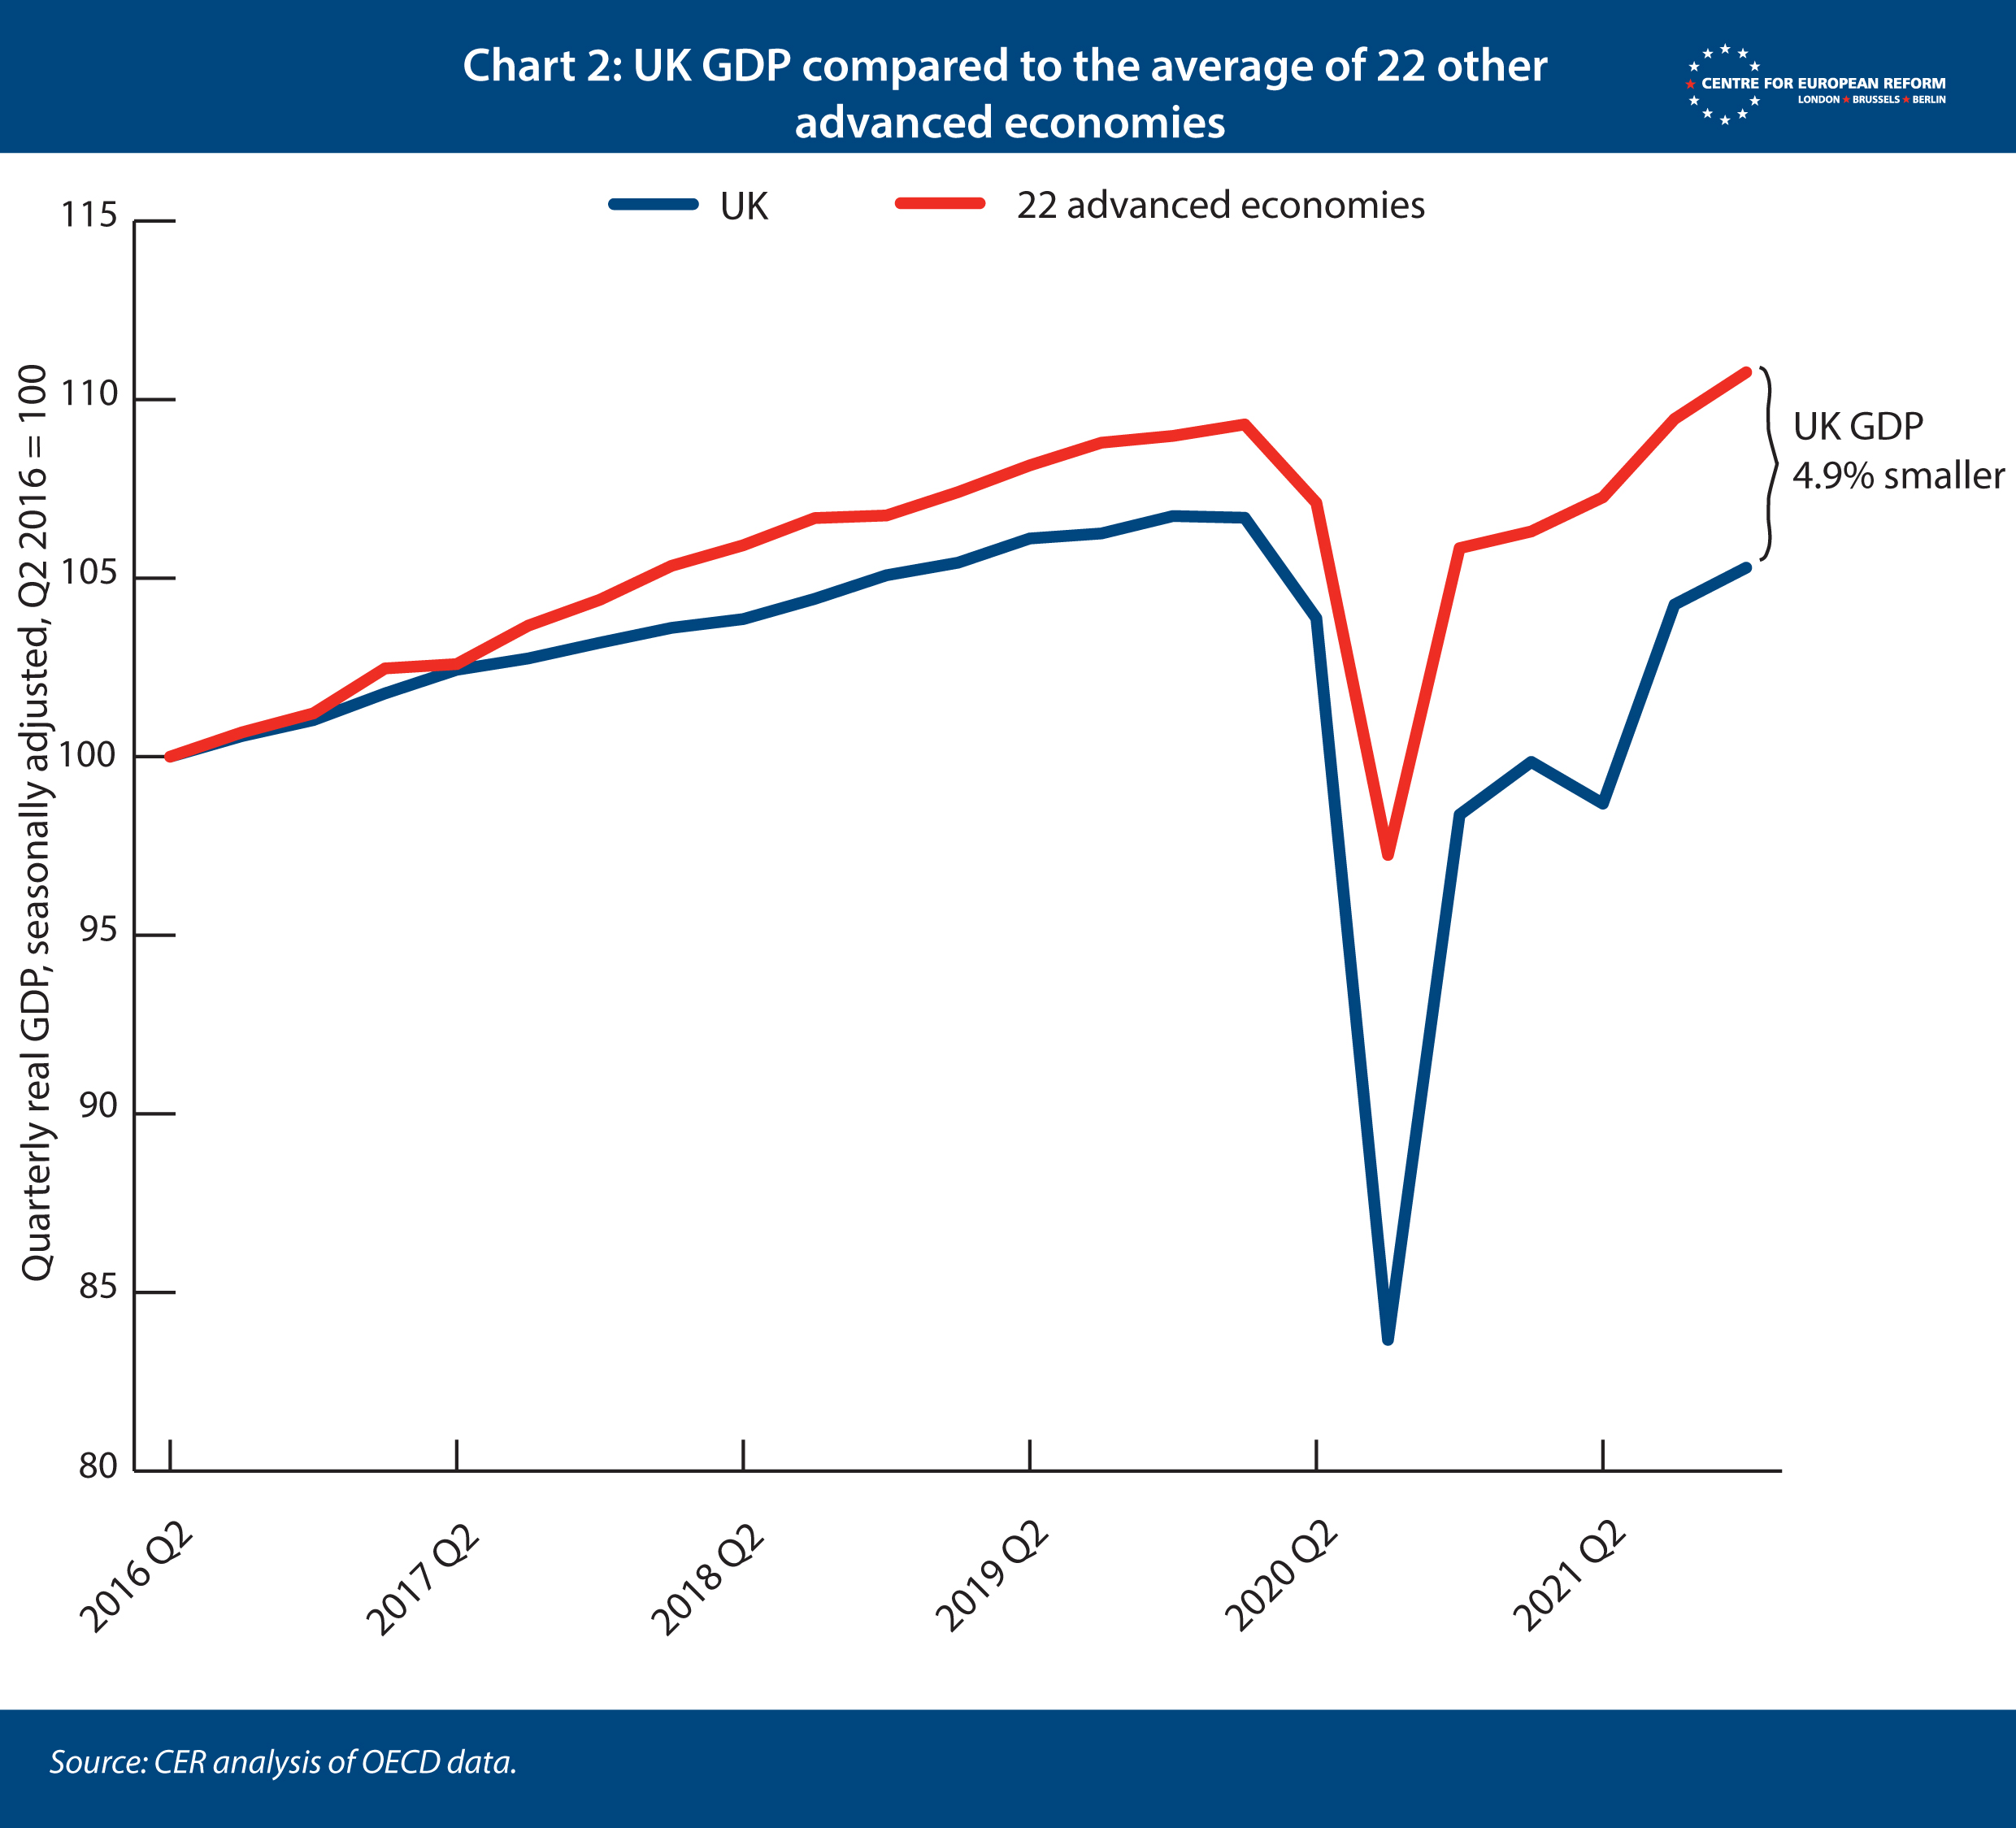
This suggests that most of the shortfall is down to Brexit, not Covid. Before the pandemic, the shortfall was sizeable, and leaving the single market will have raised the GDP cost of Brexit further. The UK had a particularly deep recession in 2020, but it ended Covid restrictions sooner than many of its peers, thanks in part to starting its vaccination campaign early in 2021. That should have made its recovery from Covid faster than other countries, not slower. We shall see whether the UK closes the gap with the doppelgänger in future data releases. But it should trouble Labour and the Conservatives, who have both been silent on the impact of Brexit on the country’s economic performance, that the economy is lagging so far behind.
It should trouble Labour and the Conservatives that the economy is lagging so far behind its peers.
Some caveats are needed. The first is that the US has a fairly heavy weighting in the doppelgänger, at 31 per cent. My method reduces the weight of any one country, but the UK and US economies are so similar that the algorithm always gives America a heavy weighting. The US has had a looser fiscal policy than the UK for several years, first with Donald Trump’s tax cuts, and then with stimulus cheques, unemployment insurance rises and other higher discretionary spending during the pandemic. This raises the estimate of the cost of Brexit and Covid a little: fiscal stimulus has raised US growth, which slightly raises that of the doppelgänger. But if I remove the US from the pool of countries that the algorithm selects, the UK shortfall is still 4.9 per cent, or £29 billion. (More comprehensive robustness checks can be found in the appendix.)
The second caveat is that GDP has been difficult to compare between countries during the pandemic. For example, national statistical institutes have chosen different ways to count the closing of schools and the rise in health spending in the national accounts. According to the data, the UK economy took an unusually large hit in the second quarter of 2020, compared to other countries, despite imposing similar lockdown measures. Data revisions may be larger than normal in the future, and the difference between the UK and other countries may grow or shrink.
Investment
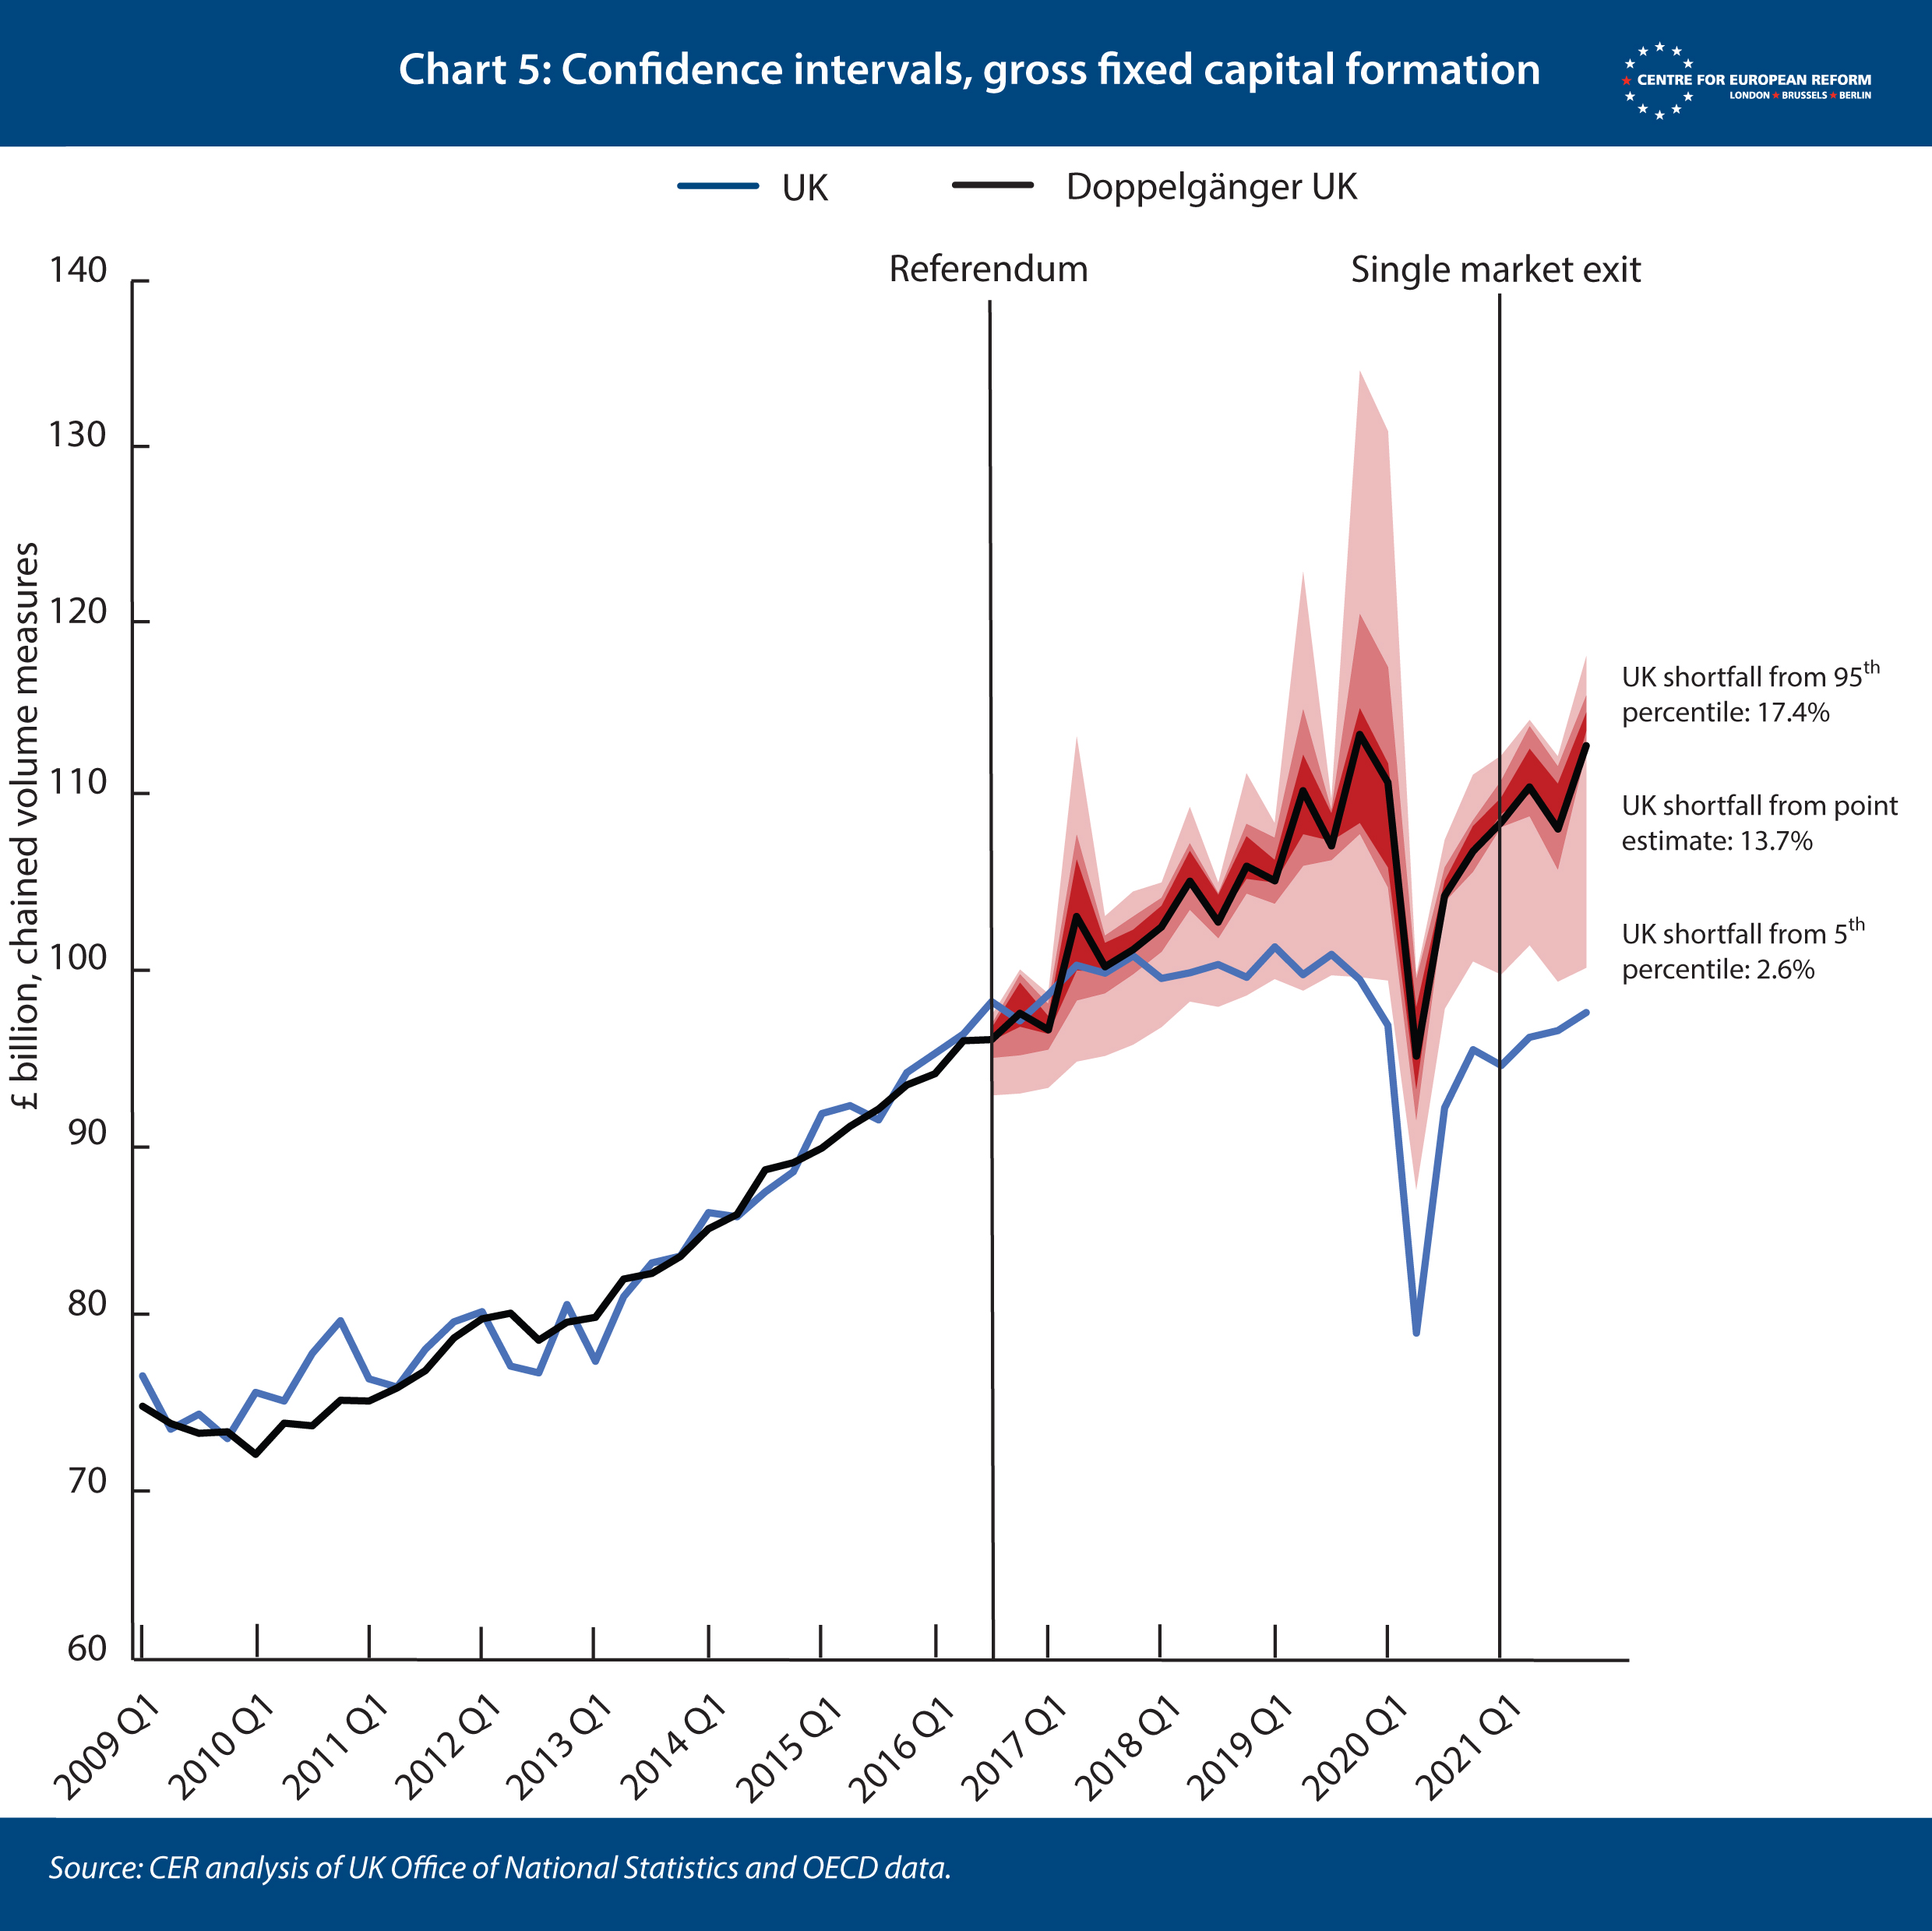
As with GDP, the estimate for investment also uses data between Q1 2009 and Q2 2016, the quarter of the referendum, to find the most appropriate countries to make up the doppelgänger. As Chart 1 shows, there is a clear Brexit effect, with gross fixed capital formation flatlining between 2016 and the start of the pandemic. By the end of 2021 investment had not recovered its pre-pandemic level, and was 13.7 per cent – or £15 billion – lower than in the doppelgänger. By contrast, the doppelgänger had recovered its pre-pandemic level. This is perhaps the most troubling estimate: future growth in productivity and living standards are dependent on investment that is made now. The UK’s investment has been flatlining.
UK investment has only outperformed Japan since the referendum, when compared to my group of 22 advanced economies. That is in stark contrast to Britain’s performance between 2008 and the referendum, when its GFCF growth was in sixth place, behind Ireland, Luxembourg, Sweden, Switzerland and the US.
The group of countries that make up the doppelgänger are the US (48 per cent), New Zealand (15 per cent), Iceland and Denmark (9 per cent each) and Japan (8 per cent). The remaining countries make up less than 5 per cent each. Once again, the US makes up a large share of the total, but if we remove it from the pool of countries that the algorithm chooses from, the UK shortfall only drops slightly to 12.6 per cent or £14 billion.
Services trade
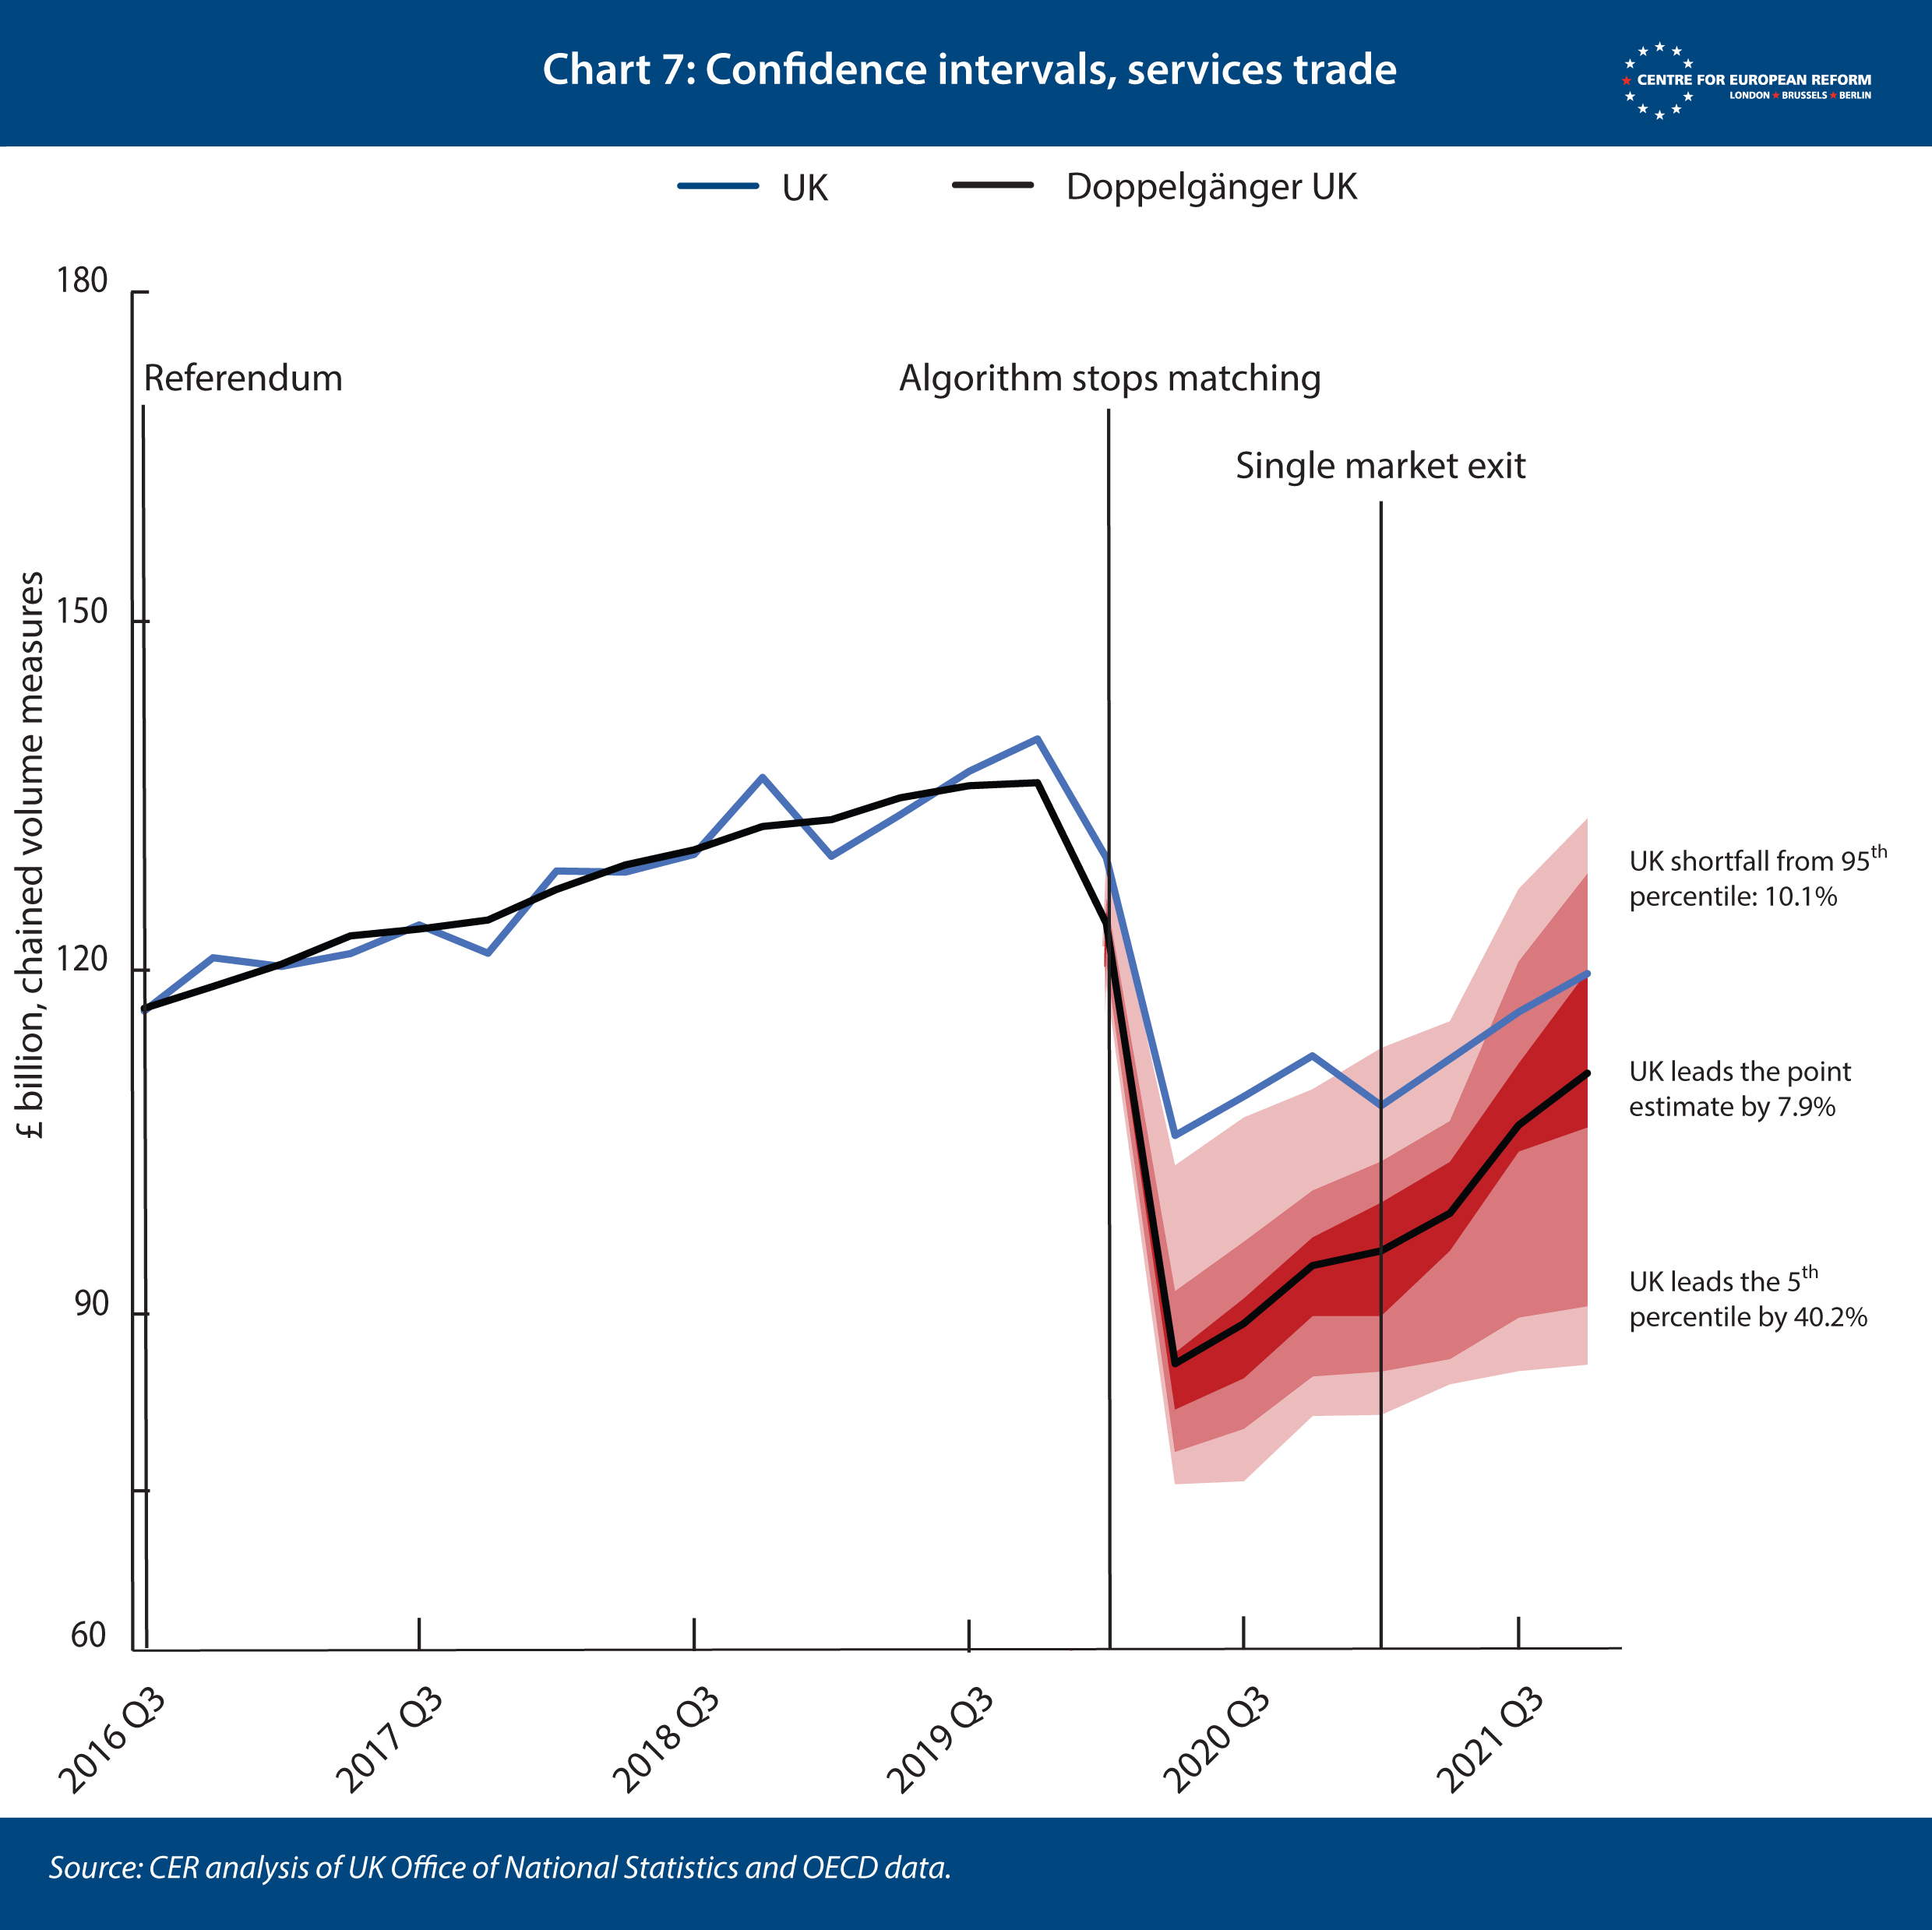
Unlike GDP and investment, the estimate for services trade uses a longer dataset – between Q1 2009 and Q4 2019 – to find the countries that make up the doppelgänger. I use a longer series because the services trade data did not show a slowdown in anticipation of the UK leaving the single market. The surprise is that UK services trade has outperformed the doppelgänger’s by 7.9 per cent, or £8.7 billion.
However, unlike the other estimates, if the largest country in the doppelgänger is removed, the outperformance of the UK disappears. This means that we cannot rule out that the effect is, in fact, zero (the appendix explains in more detail). The doppelgänger is largely made up of Australia (35 per cent), Greece (20 per cent), Spain (9 per cent), the US (8 per cent) and Germany and Luxembourg (5 per cent each). If we take Australia out of the pool, the UK goes from an outperformance of 8 per cent to a shortfall of 9 per cent.
There are two possible explanations for the uncertainty in the estimate. The first is that leaving the single market has had only a small effect on services trade: the drop in services trade in the first quarter of 2021, when the UK left, is small (see Chart 1). The second is that Covid has overshadowed the impact of Brexit, because tourism and other services that require producers or customers to cross a border make up a larger share of other countries’ services trade, while the UK is likely to have an unusually high share of services trade that can be provided remotely. Banks, financial markets, lawyers, accountants, and consultants could all continue to supply services via the internet during the pandemic, while tourism collapsed. As cross-border travel returns to more normal levels this estimate may become more certain.
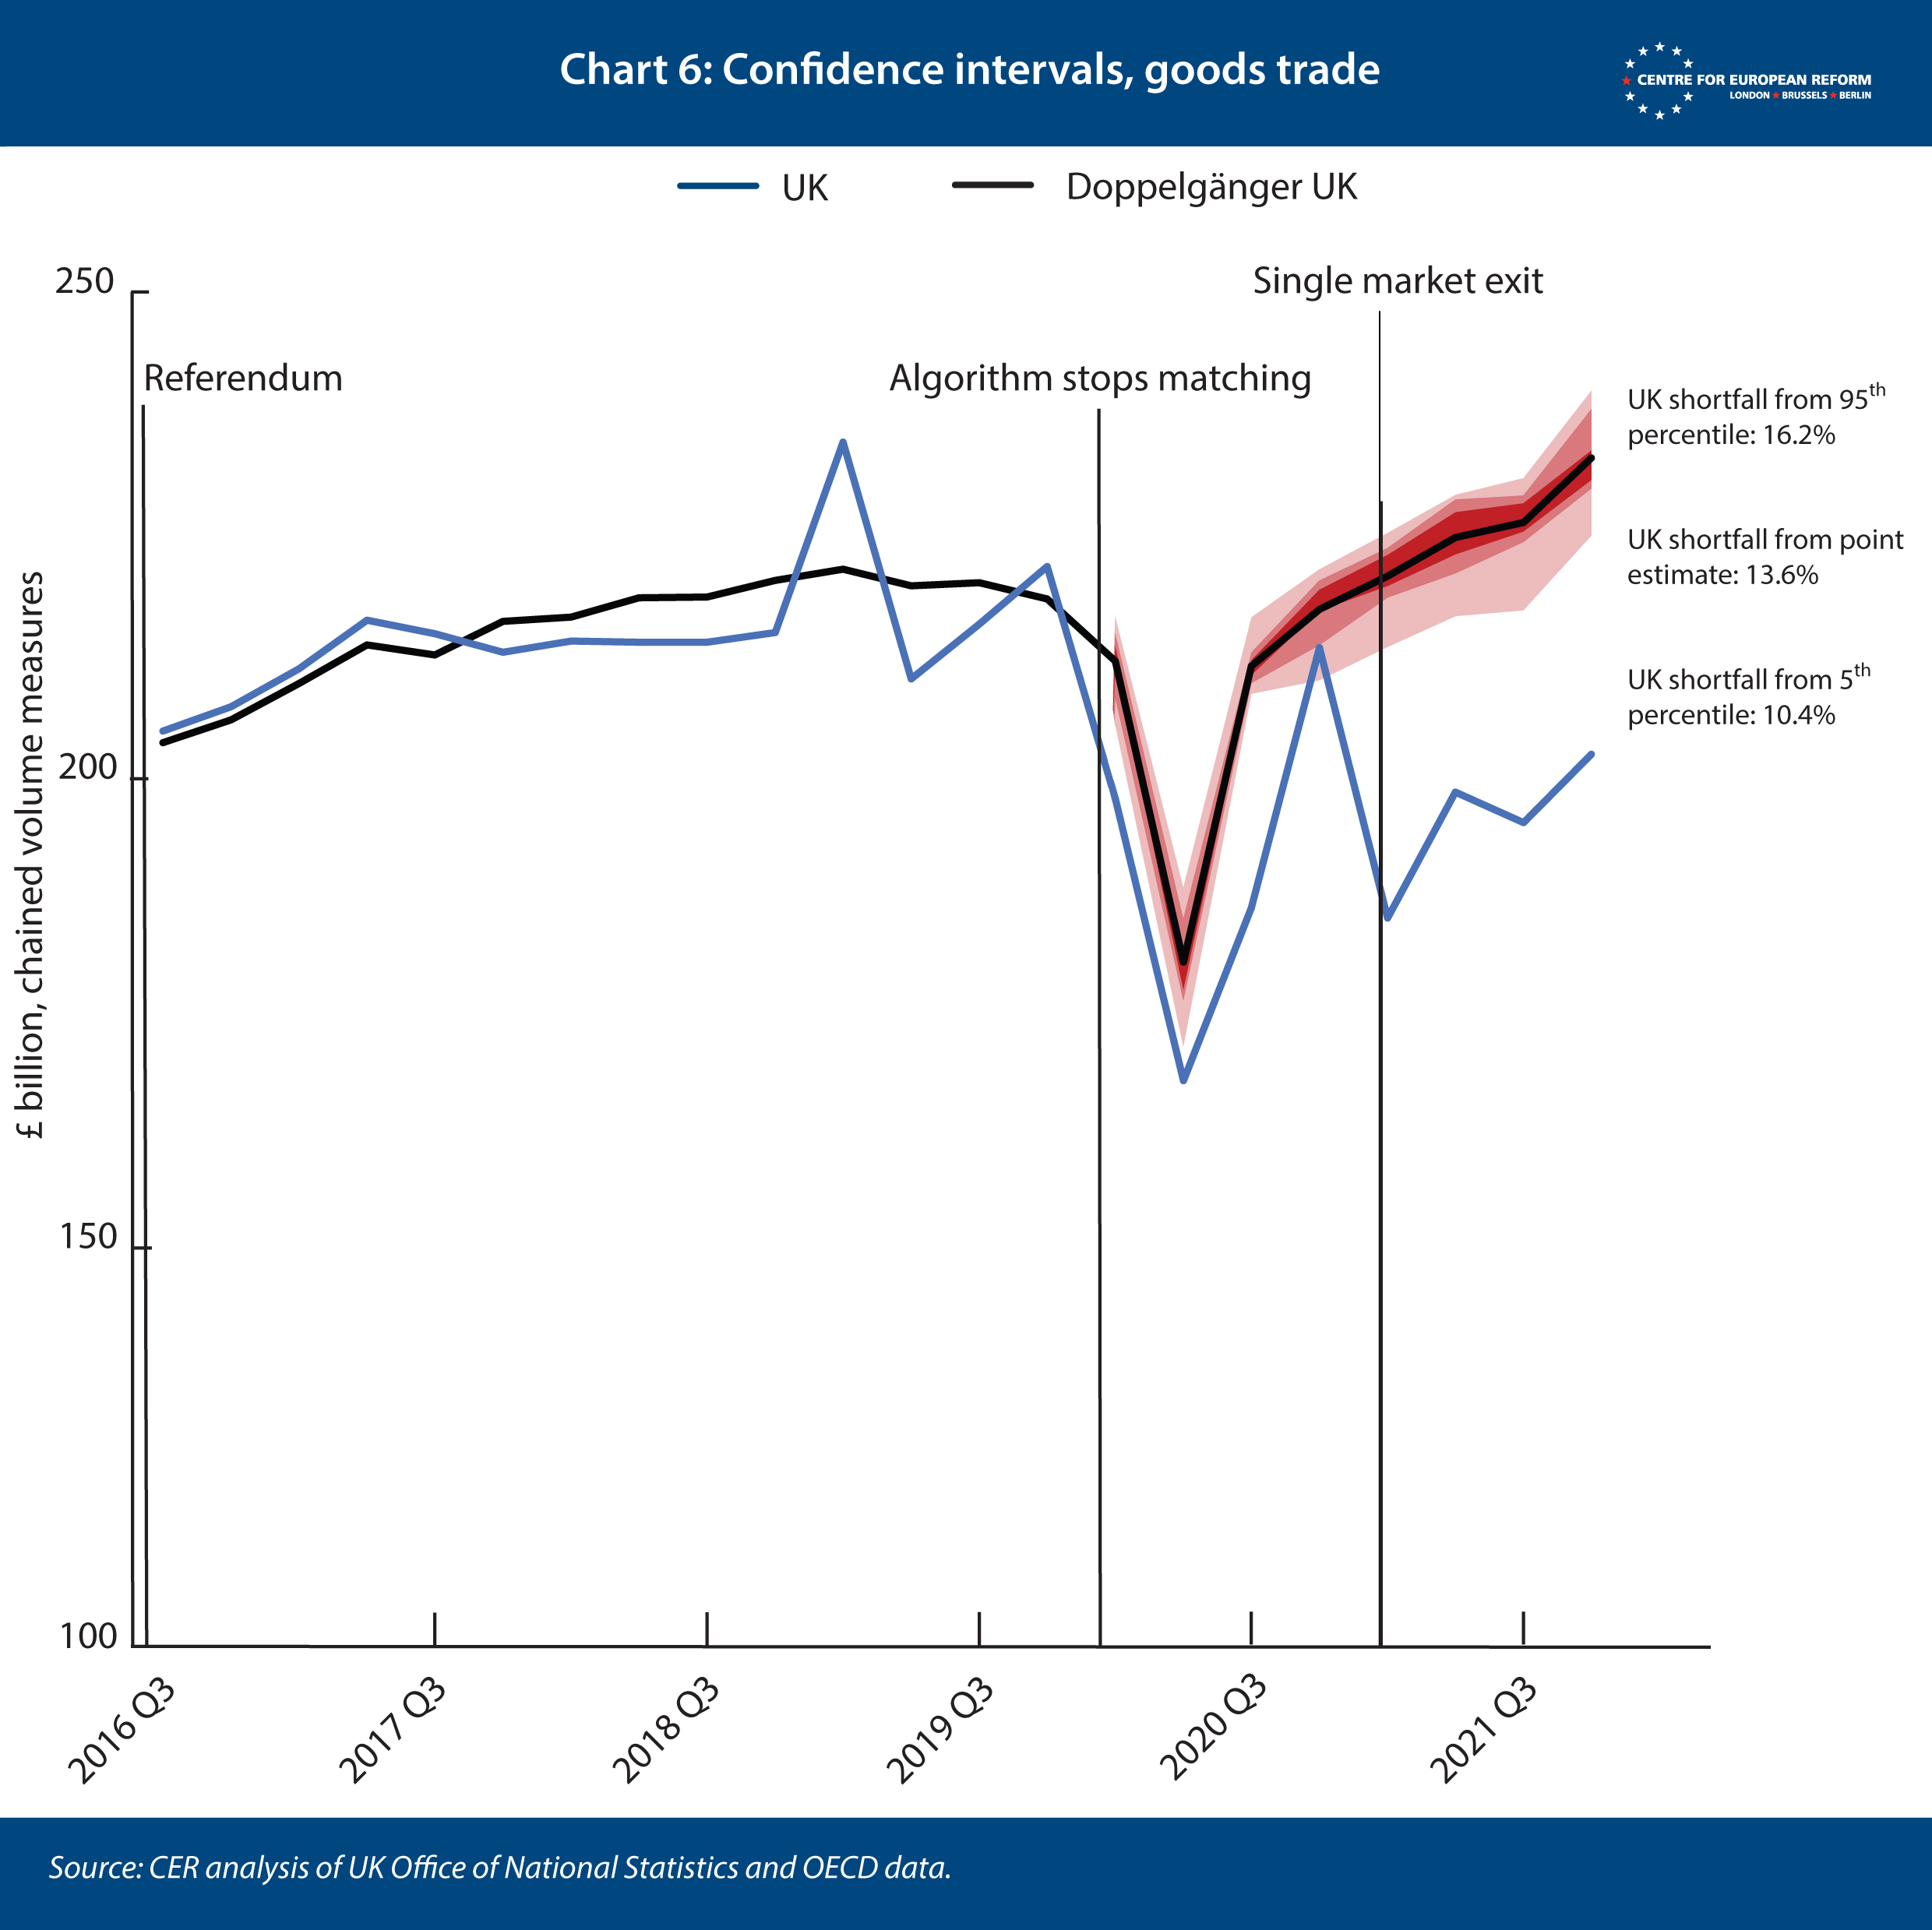
Goods trade
There are two differences between my estimate here and the series that I have published over the course of 2021. The first is that I am now using quarterly data rather than monthly. The second is that I am using constant data rather than current data, which strips out the rate of inflation in traded goods (which has been rising rapidly). But the real terms estimate is similar to the one in current prices – based on quarterly data, leaving the single market and customs union has reduced Britain’s goods trade by 13.6 per cent, compared to around 15 per cent based on monthly data.
The countries that make up the doppelgänger are the US (33 per cent), Luxembourg (11 per cent), Australia (8 per cent), Germany and Greece (7 per cent each), Iceland (6 per cent) and Italy (5 per cent). The remaining countries each make up less than 5 per cent of the doppelgänger. If anything, the high share of the US reduces the cost of Brexit estimate. If we remove the US from the pool of countries, the gap between the UK and the doppelgänger rises to 17.2 per cent.
The great majority of this shortfall is down to Brexit, not Covid: other countries have been enjoying a goods trade boom in 2021, which the UK has failed to benefit from.2 And there was a big drop in British goods trade in the first quarter of 2021, immediately after the country’s single market exit.
Labour markets and inflation
Some commentators have argued that Brexit has been a major reason why the UK now has the highest inflation rate in the G7.3 This fits economic theory: Brexit raises trade barriers with the UK’s biggest trade partner, which should push up the price of imports, and the end of free movement reduces potential labour supply. Both should add to inflation. The UK in a Changing Europe think-tank found that leaving the single market and customs union pushed up food prices by 6 per cent, for example.4
The evidence so far does not suggest Brexit is the main reason for the surge in inflation.
However, the evidence so far does not suggest Brexit is the main reason for broad-based price rises.
First, the number of people in work in the UK fell by around 480,000 over 2020 and 2021, but that was driven more by British workers moving into inactivity than by the loss of EU workers. The Office of National Statistics now reckons that the net loss of EU citizens was around 94,000 in 2020.5 The number of inactive working age people, by contrast, rose by 630,000 between Q1 2020 and Q4 2021, as many older workers left the labour market.6
Second, UK and eurozone measures of imported inflation are not very different, which suggests that both jurisdictions are equally struggling with rapid inflation in imported goods, energy and other commodities. ‘Import deflators’ measure import prices, and while the UK had more rapid import inflation between 2017 and 2021, the eurozone had faster inflation in 2021, the year that the UK left the single market and customs union.
Conclusion
These estimates are broadly in line with those of the Office for Budget Responsibility (OBR), the independent body charged with making official forecasts, which the Chancellor must use as a basis for his tax and spending decisions. The OBR forecasts that Brexit will reduce UK productivity by 4 per cent in the long run. By contrast, its long-term forecast for Covid assumes that the pandemic will reduce UK GDP by about 2 per cent.
Brexit is the main reason why Chancellor Rishi Sunak is raising taxes to their highest share of GDP since the 1960s.7 While the Chancellor has claimed that his increase in national insurance contributions (a payroll tax) is to fund the health service and social care, these tax rises would not have been needed if the UK had stayed in the EU (or in the single market and customs union). Ian Mulheirn, chief economist of the Tony Blair Institute, has shown that according to the OBR’s forecasts Brexit will worsen the public finances by £30 billion. Sunak’s March 2021 tax rises amounted to £29 billion.8
It is difficult to disentangle the impacts of Brexit and Covid on the UK economy with precision. But it is hard to avoid the conclusion that Brexit has severely curtailed GDP, investment and goods trade (while the jury is still out on services trade, and inflation appears to have been more driven by global factors than Brexit). British politicians may find it difficult to ignore the central role of Brexit in the UK’s economic problems for much longer.
Appendix
I discontinued the CER’s first ‘cost of Brexit’ model, which estimated the hit to GDP, after the second quarter of 2019. That was because, over time, the countries that were in the doppelgänger were subject to other economic shocks that had nothing to do with Brexit. For example, I found that the rising gap between the UK and the doppelgänger between Q3 2016 and Q2 2019 was in part driven by Donald Trump’s tax cuts. Those tax cuts exerted a stimulus that was forecast to be around 0.7 per year from 2018.9 When I excluded the US from the doppelgänger in the June 2019 data, the doppelgänger’s economic output dropped and the gap with the actual UK data was smaller.
In these new estimates, US fiscal policy could cause similar problems: Trump and Joe Biden’s sizeable income support measures have significantly raised US consumption and therefore imports, and if the US forms a sizeable part of the UK doppelgänger, it may artificially inflate the cost of Brexit.
I have tried to resolve those problems in the new models focused on GDP, investment, and services and goods trade. To do so, I combined my method with that of two academics, Thiemo Fetzer and Shizhuo Wang, who used the ‘synthetic counterfactual’ approach to estimate the cost of Brexit for the regions of the UK.10
In my models, I train the algorithm on countries that are as similar as possible, as measured by investment as a share of GDP, the average years of schooling of the adult population, the share of industrial production in gross value added, the inflation rate, the share of trade to GDP, and GDP per capita. This ensures that the algorithm does not, for example, pick countries that had weak growth after the financial crisis, matching that of the UK, but which have a faster structural growth rate because they are less developed. If these countries were selected for their moderate growth to 2016, but then they grew more rapidly after the referendum for reasons unrelated to Brexit, then the doppelgänger UK would be biased upwards.
Because they were using regional data, Fetzer and Wang did not have access to the range of indicators that I use to ensure that countries that make up the doppelgänger UK have similar economic structures. There is no data on the average years of schooling of populations or the trade-GDP ratios at a regional level across Europe and the US, for example. They instead asked the algorithm to find the European regions and US states whose economic growth matched, for example, the English county of Kent up to the referendum, and then measured the difference afterwards to get their estimate. But to ensure that a region of Hungary, a country with a faster structural growth rate than Britain’s because it is less developed, did not dominate the doppelgänger Kent and bias it upwards, Fetzer and Wang repeatedly ran the algorithm and randomly dropped regions from the ‘donor pool’ – the full set of regions from which the algorithm selects those that most resemble that region of interest. Fetzer and Wang dropped regions to create donor pools that contained a random set of 5, 10, 15, 20, 25 and 30 regions. They then took the average of the doppelgängers that this repeated exercise produced.
This procedure ensured that their model was not ‘overfitted’, meaning that it was not matching on particular regions just because their economies performed similarly to Kent, but for reasons unrelated to Brexit. I use this procedure in our national-level model, to ensure that the UK’s economic performance is not too dependent on the US and New Zealand – or indeed other countries that closely matched the UK, either up to the referendum, or up to the single market exit in January 2021.
I therefore combine these approaches, using a range of predictors but randomly dropping countries in our two models – model 1 measuring the hit to services and goods trade from leaving the single market in Q1 2020, and model 2 measuring the hit to GDP and investment from the vote to leave in June 2016.
Model 1.
In the first period, between Q1 2009 and the Q2 2016, I make the algorithm minimise the difference between the UK’s and our 22 countries’ total services and goods trade, seasonally adjusted and in constant prices. The algorithm also minimises the difference between the UK’s and 22 countries’ real GDP growth, inflation rates and the other indicators mentioned above. (In the literature, this is called a ‘training’ period.) In the second period, between the Q3 2016 and the Q4 2020, I program the algorithm to minimise the root mean squared prediction error, which means that the algorithm focuses on total trade and the other indicators are ignored. I end in Q4 2020 in order to remove the effects of the pandemic from the doppelgänger.
In order to prevent the US – or other countries – from dominating the results too much I repeatedly run the model on donor pools from which countries have been randomly dropped. I run the model on a donor pool of 5, 7, 9, 11, 13, 15, 18, 20 and 22 countries. That means that the US appears in the donor pool, on average, 60 per cent of the time. The dependence of the algorithm on any one country is thereby reduced.
This method allows us to strike a balance between:
- a doppelgänger that has similar overall economic characteristics to the UK, rather than simply having a similar trade performance in the period of interest;
- a doppelgänger heavily skewed towards the US and other countries, and therefore susceptible to positive or negative economic changes in those countries that have nothing to do with Brexit.
Model 2.
This model is the same, but the training and matching periods are different. Because we are interested in the effects of the referendum, I ‘train’ the algorithm between Q1 2009 and the Q4 2011 on all of the indicators. I then only match on GDP or GFCF between Q1 2012 and Q2 2016, the quarter of the referendum.
I repeatedly run the algorithm on donor pools that have been randomly selected according to the procedure above, which has the effect of reducing but not eliminating the weight of the US in the doppelgänger.
Robustness tests
It’s possible to use the estimates from the restricted donor pools to test how robust these models are. By running the model on a donor pool of 5, 7, 9, 11, 13, 15, 18, 20 and 22 countries, we end up with a set of estimates based on randomised donor pools. From these estimates, we can calculate 5th, 20th, 35th, 65th, 80th and 95th percentiles, which gives us measures of uncertainty for our point estimates.
The results are below. The GDP, GFCF and goods trade are all robust at the 5 per cent level, meaning that the UK even underperforms a doppelgänger that’s formed from the 5 per cent weakest donor pool (which might include, say, Italy, Japan, Greece and other countries that had weak growth during our period). However, services trade was not robust at all. The UK was not outside the 5th and 95th percentiles on the fan chart, so we have to assume that it has neither outperformed nor underperformed the services trade of other countries after Brexit and Covid.
As ever, I am making the code and input data for each of my models publicly available. They can be accessed using the links below.
2: John Springford, ‘The cost of Brexit: December 2021’, CER insight, March 10th 2022.
3: Adam Posen and Lucas Rengifo-Keller, ‘Brexit is driving inflation higher in the UK than its European peers after identical supply shocks’, Peterson Institute for International Economics, May 24th 2022.
4: Jan David Bakker and others, ‘Post-Brexit imports, supply chains, and the effect on consumer prices’, UK In A Changing Europe, April 27th 2022.
5: ‘EU migration to and from the UK’, University of Oxford Migration Observatory, February 15th 2022.
6: CER analysis of UK Office of National Statistics data.
7: Philip Inman, ‘Rishi Sunak’s tax rises: Three of the biggest examined’, The Guardian, May 27th 2022.
8: Ian Mulheirn, ‘Brexit is already costing us billions – and it could get worse’, Huffington Post, March 11th 2021.
John Springford is deputy director of the Centre for European Reform.
June 2022
View press release
Download full publication
This publication was translated into Spanish and pubished in ESglobal, view here.
Related content

CER podcast: Is Brexit to blame for Britain's economic woes?

The cost of Brexit: December 2021
