

The impact of Brexit on immigration to the UK
A new analysis finds that Brexit raised the number of foreign-born workers in the UK by about 200,000, but resulted in a more dramatic shift in the countries of origin.
Brexit was expected to affect the UK economy through two main channels, trade and immigration, and in particular the latter’s impact on employment. There have been various attempts to estimate the impact of Brexit on trade, but relatively few that look at immigration. In this note, we provide quantitative estimates of how the non-UK born workforce would have evolved in the absence of Brexit.
Boris Johnson’s government implemented a new immigration system in January 2021, which substantially liberalised the visa regime for non-EU workers as free movement with the EU ended. Most analyses of the impact of Brexit on migration – both prior to the 2016 referendum and the implementation of the 2021 immigration system – forecast that Brexit would lead to a modest reduction in overall immigration to the UK, with the fall in migration resulting from the end of free movement being partially but not wholly offset by a rise in non-EU migration. For example, the Home Office estimated that the new system would reduce work-related migration by about 40,000 per year.
In fact, immigration rose sharply in the years immediately after the implementation of the new system, with net migration rising to record levels in 2023. That rise prompted successive Home Secretaries to tighten the system as the public debate became increasingly rancorous. Combined with a weakening labour market, that tightening has led to a sharp fall in the number of work visas issued, including to dependants – from 541,100 in 2023 to 186,000 in 2025, with further declines in recent months.
Our estimates, described below, show that despite the UK gaining full autonomy over migration policy in 2021, Brexit and the new immigration regime led to a modest rise in the overall number of foreign-born people in work. Our counterfactual exercise finds that Brexit had raised the number of foreign-born workers by 207,000 in 2024 – equivalent to about 0.6 per cent of the total workforce, with a large drop in EU-born workers, about 2.3 per cent of the workforce, being offset by a slightly larger rise in non-EU workers (2.95 per cent of the workforce). The UK may have taken back control, but outcomes have been similar to those expected in the alternative timeline in which Remain won the referendum.
As with other attempts to estimate the economic impact of Brexit, it is impossible simply to attribute the fluctuations in immigration to Brexit. Other factors – the pandemic and its after-effects, the Ukraine war, and the visa scheme for Hongkongers fleeing China’s security laws – also played a part. In this brief, we apply similar methods to those used to calculate the impact of Brexit on GDP and trade flows to estimate the impact of Brexit on the number of foreign workers in the UK. That is, we construct a counterfactual estimate based on a weighted average of comparable countries, chosen by an algorithm to best match the observed figures for the UK in the pre-Brexit period. A fuller explanation of the method is provided in the appendix.
This method is preferable to simply extrapolating pre-Brexit trends, since migration to the UK after 2016 was affected by various shocks that were unrelated to Brexit. It is also preferable to simply comparing the UK to one other country, like Germany. Moreover, given that migration to the UK from EU countries under free movement is also influenced by developments in ‘source’ countries, such as income convergence, it is highly unlikely that it would simply have continued to grow in line with the previous trends. Our method controls for shocks – in particular the pandemic, the post-pandemic labour shortages that emerged, and labour market developments in source countries – that affected both the UK and comparable countries in roughly similar ways.
We make two important choices in constructing our counterfactual:
- We restrict our sample of comparable countries to the EU-15 and EEA. This is because we want our estimate of what would have happened in the counterfactual UK – where Brexit does not take place – to reflect what would have happened if free movement had remained in force. This rules out using non-EU/EEA advanced economies, because they do not have EU free movement, and also means that using major ‘source’ countries for intra-EU migration such as Poland, Romania and Bulgaria is problematic.
- We use workforce stocks rather than immigration flows, which have been repeatedly revised in the UK, and are not always collected on a comparable basis across countries. Nor do we rely on the Labour Force Survey, which has had well-publicised issues with its sampling of foreign-born residents. Instead, we use data on non-national employees from HMRC for the UK; and data on foreign-born employees from the EU Labour Force Survey data compiled by Eurostat. This is not perfect, but in our view represents the most credible and reliable relevant data currently available. Focusing on migrants in the workforce also has the advantage that it is less likely than overall immigration to be affected by country-specific shocks to refugee and asylum flows.
We estimate impacts separately for EU-origin and non-EU-origin migrants. We then face a choice as to when to assume ‘Brexit’ begins to impact migration flows. For EU-origin migrants, we take this to be the referendum, since there was considerable press and public commentary, both in the UK and in source countries, on the impact of Brexit on both free movement and the future rights of EU citizens in the UK. The depreciation of sterling immediately after the referendum also meant some of its impact was front-loaded, as remittances from the UK to source countries were less valuable. For non-EU migrants, however, there was relatively little change in migration policy or the perceived security of their residence rights until the actual implementation of the post-Brexit migration system in January 2021. However, in both cases, we vary these assumptions and show that the impact estimates are broadly similar.
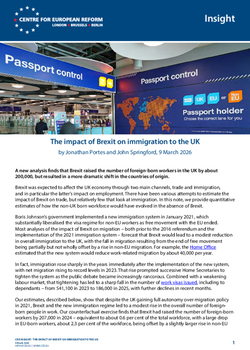
For EU-origin migrants, our results are shown in Chart 1 below. The countries with the largest weights in the control are Germany (11 per cent), Austria (10 per cent), Finland, Ireland and Belgium (all about 9 per cent). The chart shows that by 2024, the number of EU-origin workers in the post-Brexit UK was roughly back to its level at the time of the referendum, while in the basket of comparable countries, the counterfactual UK, the number had risen by about 30 per cent. This implies that Brexit had reduced the number of EU-origin employees by about 785,000 by 2024. We also show confidence intervals for this estimate, shaded in grey (see the annex for more details).
If we repeat this process, but take the start date for our impact estimation to be January 2021, the results are very similar. It is worth noting that essentially all of the estimated impact materialises by about 2023 – during 2024 both the actual UK and the counterfactual are broadly flat, meaning that our estimate suggests that the impact of Brexit on the number of EU-origin employees had largely played itself out by then.
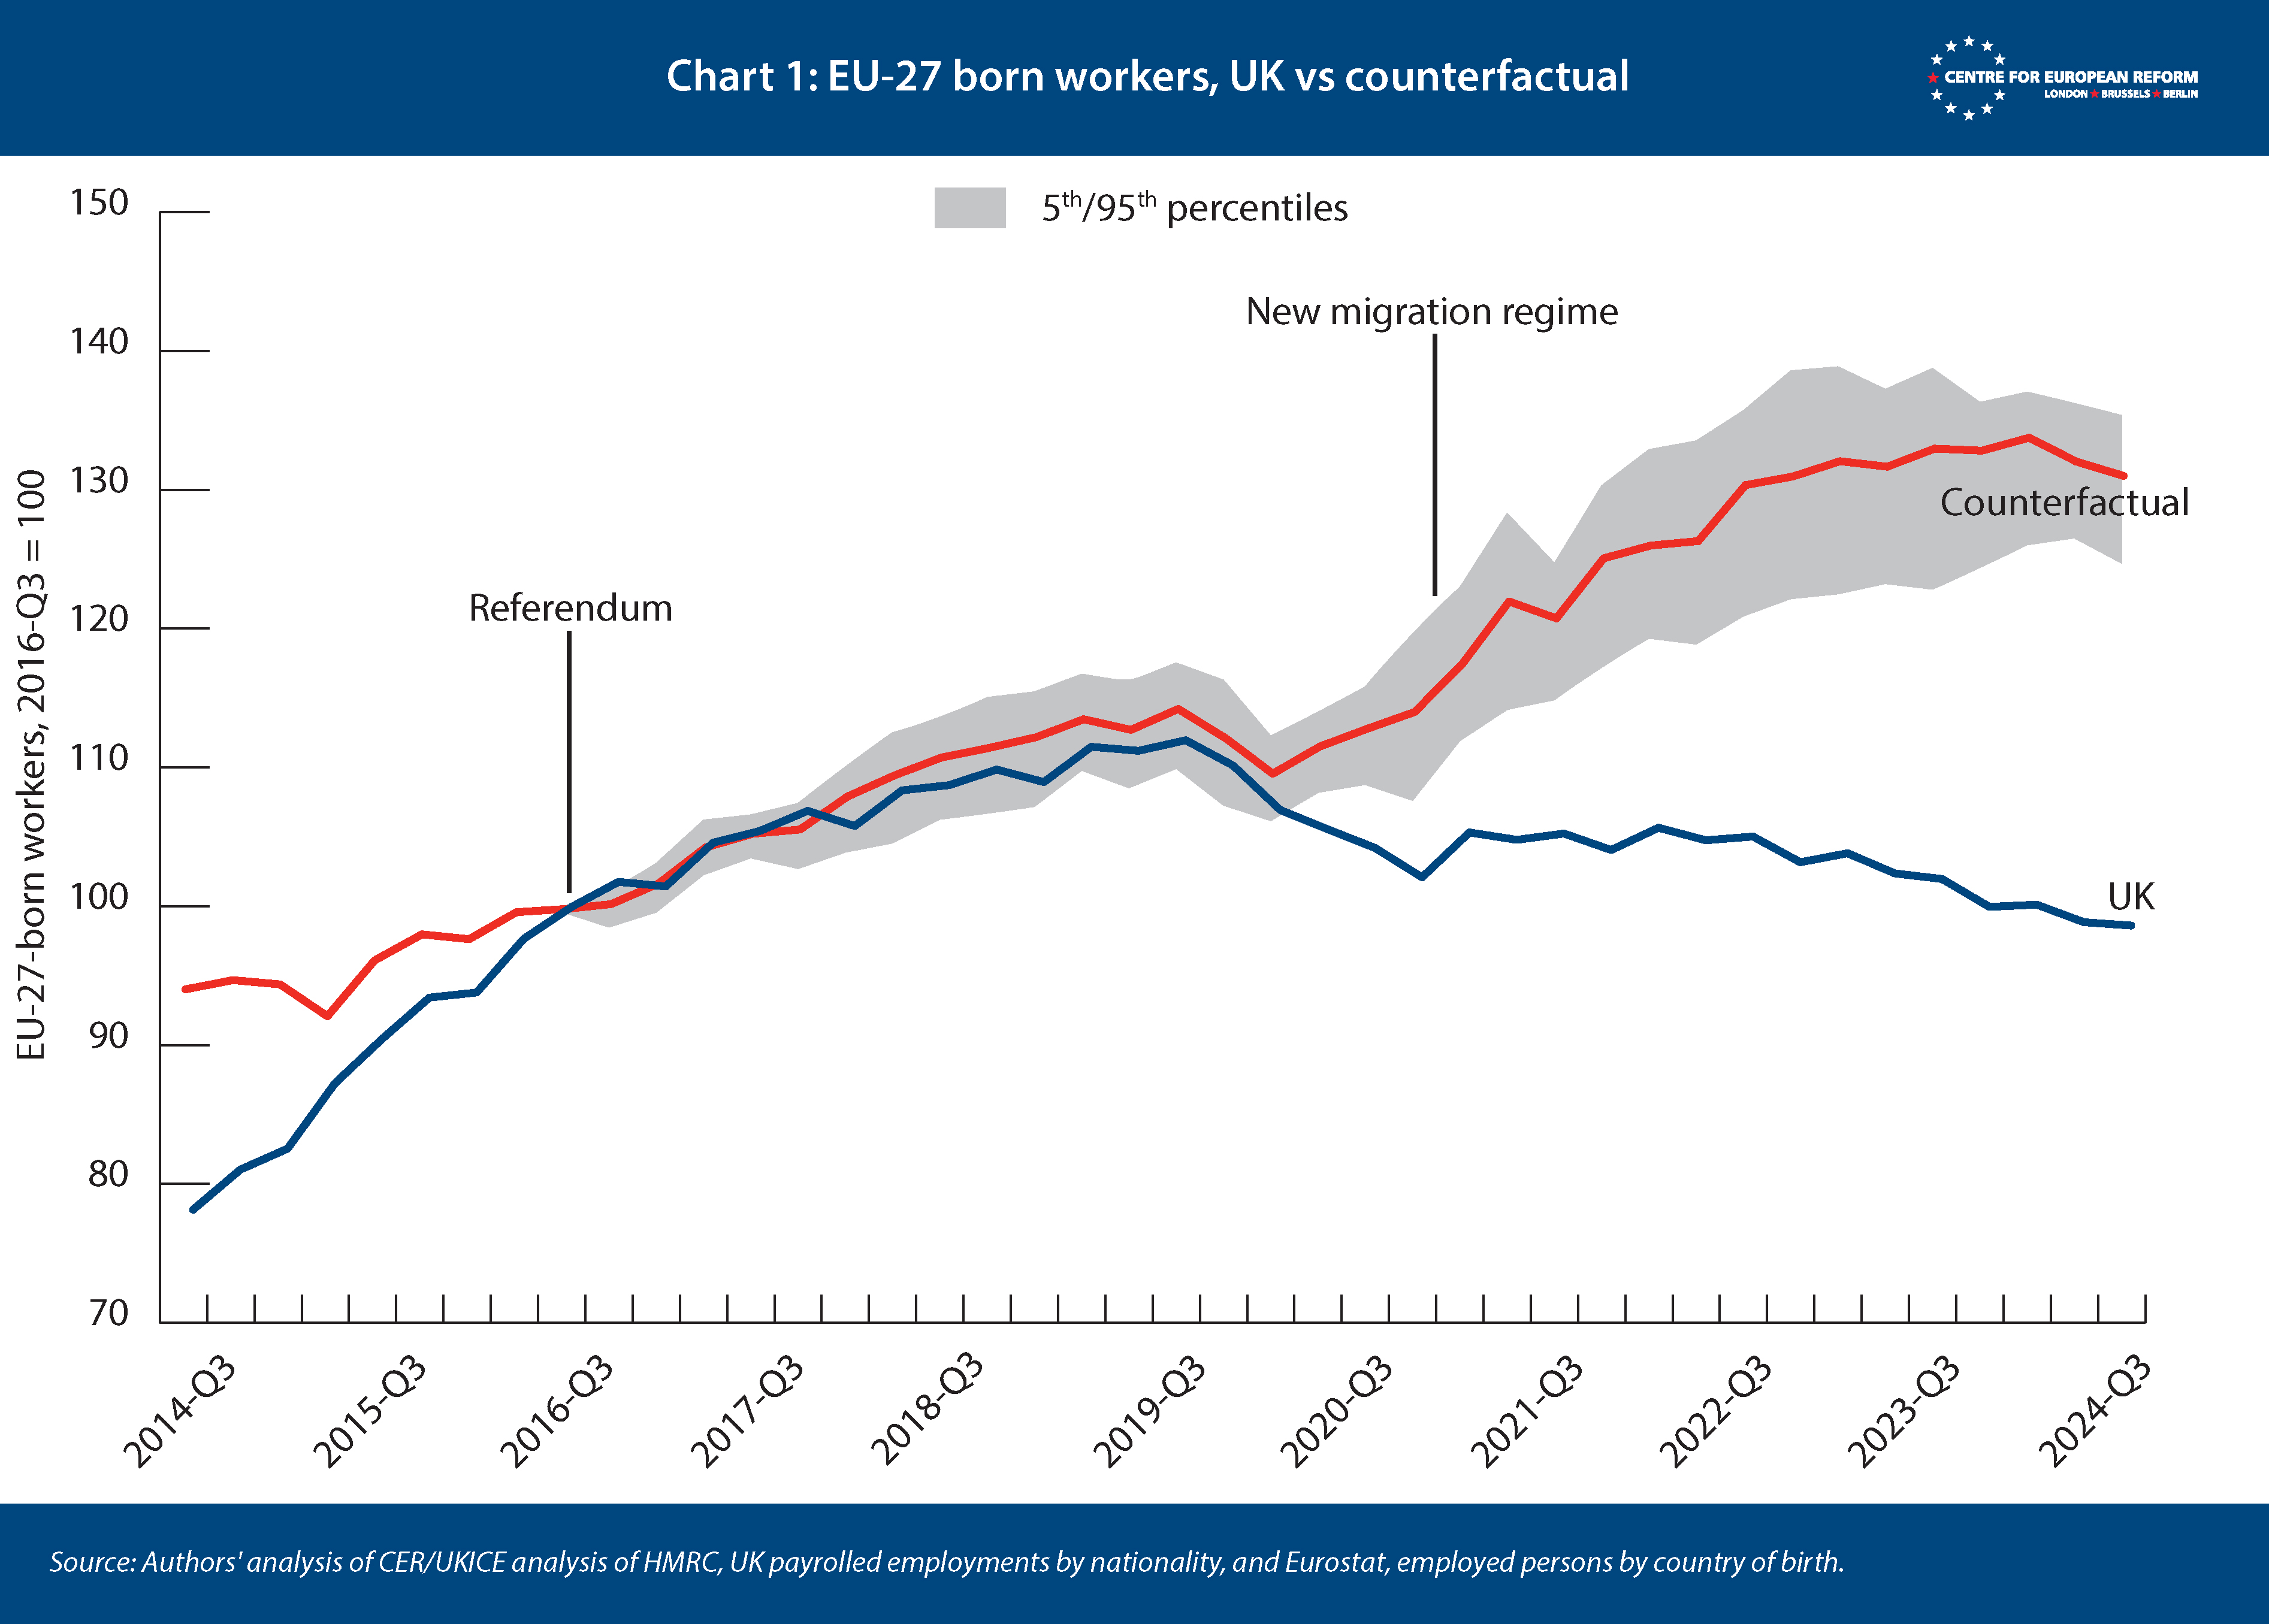
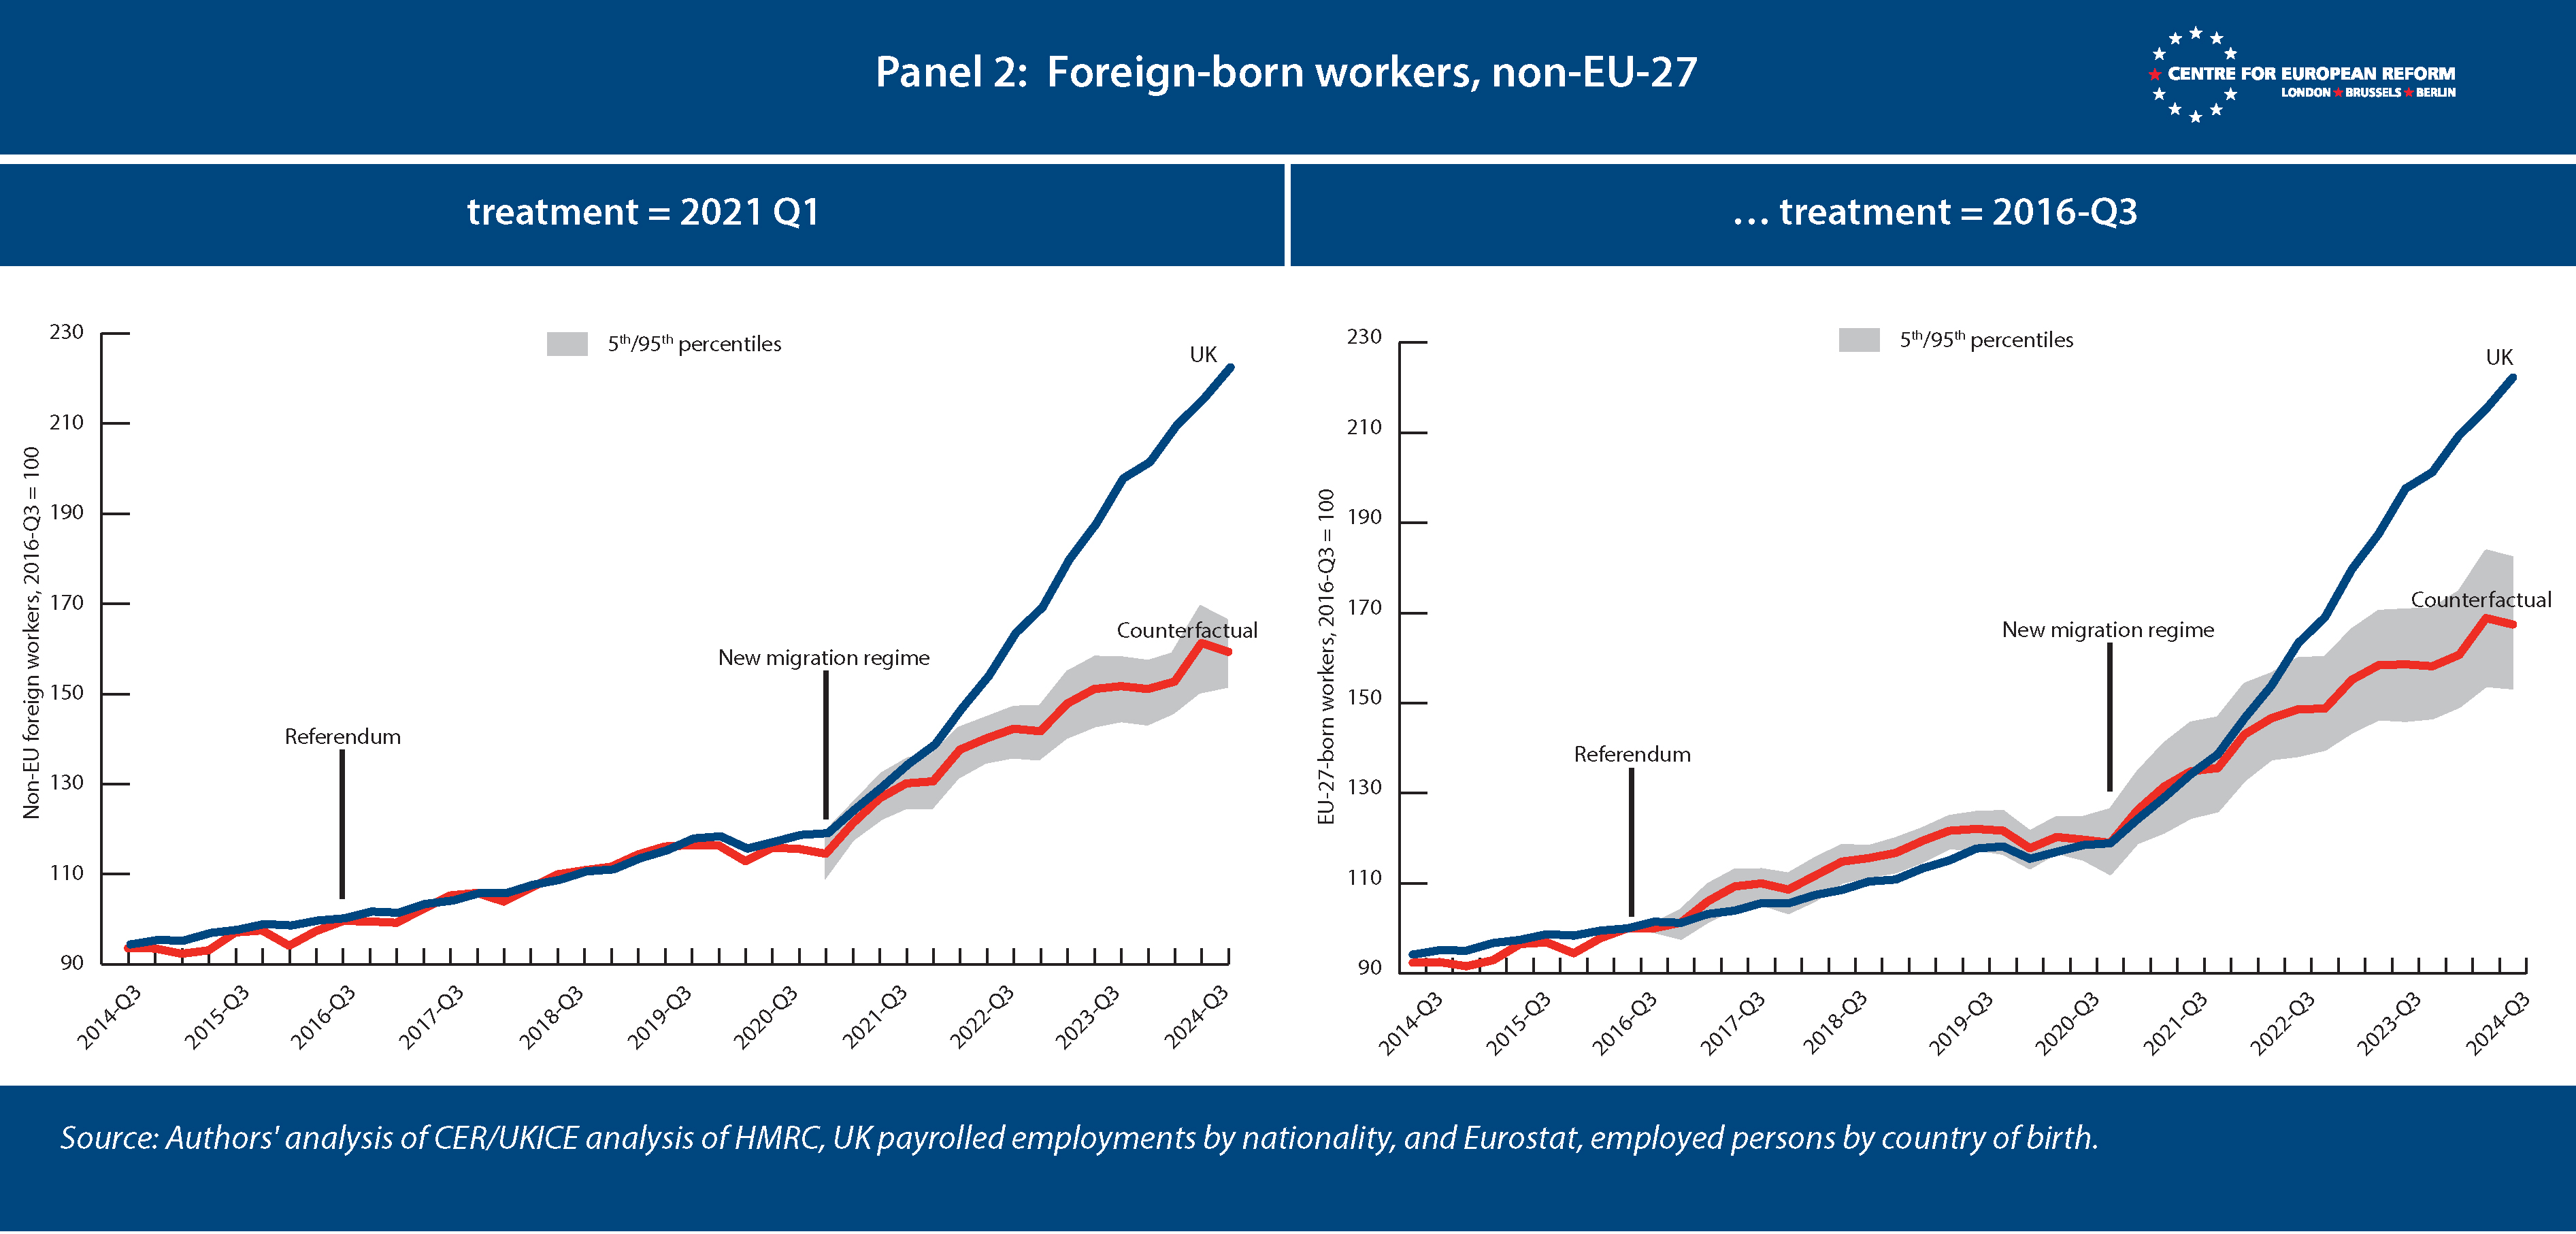
For non-EU employees, the picture is quite different. Here the counterfactual shows a sharp rise after 2021, rising to over 150 per cent of its 2016 level by the end of 2024; but the actual UK showed a much larger rise to about 225 per cent. Looking at 2024 as a whole, this implies there were about 992,000 additional non-EU employees. Basing the calculation on 2016 instead of 2021 slightly reduces the result. The largest country weights for this control are Switzerland (9 per cent), France, Denmark, Italy and the Netherlands (all about 8 per cent).
As well as going in the opposite direction, the profile of the impact is quite different. Instead of flattening off, it continues to grow, in a roughly linear fashion. During this period, the new system appears to have led to a roughly constant increase in work-related migration flows, of about an extra 70,000 employees per quarter. If that were to continue, this would lead to a steadily growing impact on the number of non-EU origin employees in the UK workforce. However, we already know from both visa and immigration data that non-EU immigration to the UK for work slowed very sharply in 2025, because the visa regime was tightened and demand-supply mismatches in the British labour market eased. A continued, linear rise in non-EU workers is highly unlikely, and 2024 may represent the peak impact of Brexit on non-EU origin employees.
Our estimate of the net effect of Brexit, then, is an increase in non-UK origin employees of approximately 207,000 in 2024, averaged over the calendar year; this is equivalent to about 0.6 per cent of the overall workforce. However, this relatively small impact is the net effect of two large and mostly offsetting changes; a reduction in the number of EU-origin employees of about 785,000 (2.3 per cent of the total workforce) and an increase in non-EU origin employees of about 992,000 (2.95 per cent of the total workforce).
As visa issuance has been dropping rapidly, net migration to the UK is likely to fall further over 2026, with one forecast suggesting it might be less than 100,000 in 2026. The dilemma facing all European governments – between maintaining employment as societies age and accommodating political pressure to reduce immigration – has not been resolved by Brexit, and our estimates show that the decision to leave the EU made only a modest difference to the number of foreign-born workers in Britain.
Appendix – synthetic difference-in-differences
The synthetic difference-in-differences method (SDID) is similar to the synthetic control method (SCM) that has been used to estimate Brexit’s impact on GDP. An algorithm finds a weighted basket of countries from a ‘donor pool’ (in our case the EU-15 and EEA) which, when combined, minimise the difference in ‘pre-treatment’ trends, before the Brexit referendum in June 2016, just as with SCM. That basket of countries forms the control which can be used to measure divergence in trends after Brexit.
SDID extends this procedure by also estimating ‘time weights’, which prioritise quarters in the pre-treatment period when trends in the countries that make up the control are closest to trends in the post-treatment period. This is helpful in our case, because the HMRC data, which starts in July 2014, gives us only a short period of time before the 2016 referendum. Furthermore, transitional controls on free movement for Bulgarians and Romanians ended in 2014, which raised the rate of intra-EU migration. The SDID method allows us to form a control from the trends shortly before the referendum.
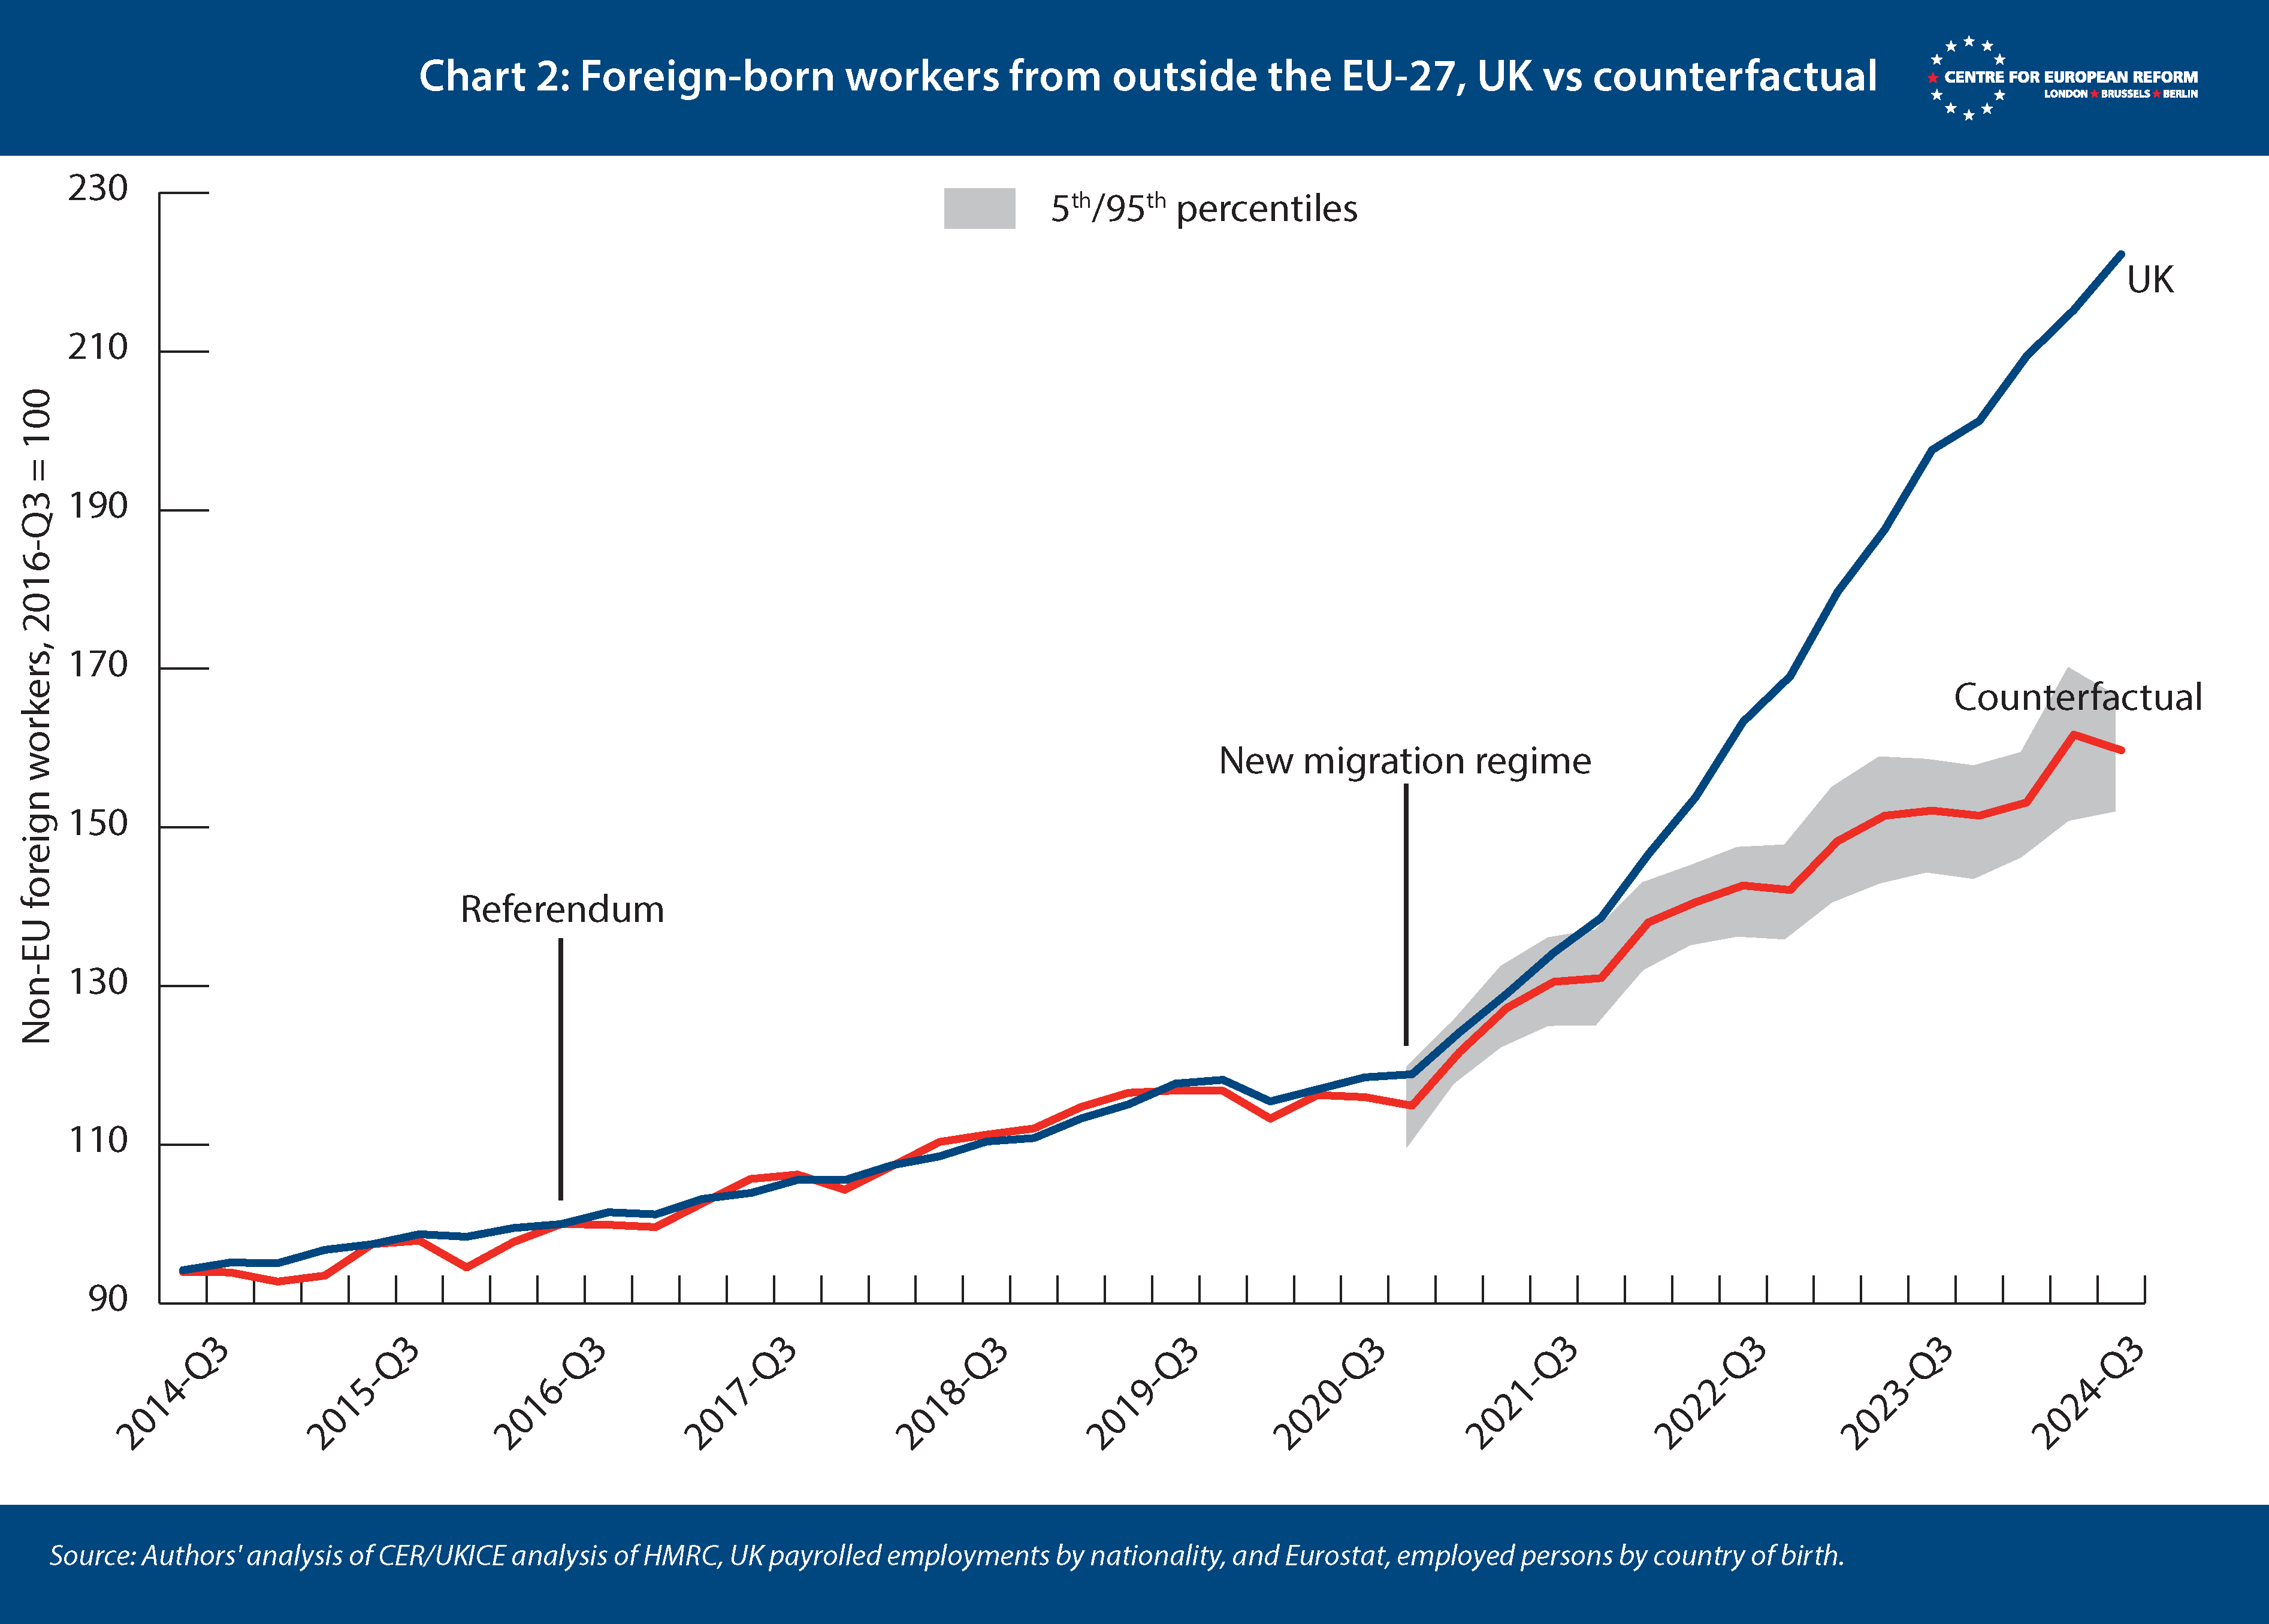
We ran two checks to test our estimates. First, we changed the time of the treatment from the third quarter of 2016 to the first quarter of 2021 for our estimate of EU workers; and vice versa for non-EU workers. As the panel of charts below shows, that made only small differences to our estimates. In the case of EU-born workers, that implies that the countries in our control had a broad-based, continued rise in free movement flows after 2016; there was no idiosyncratic rise in EU migration in the control that the UK would not also have had, if it had voted to stay in the EU. If that had been the case, the algorithm would have selected other countries from the donor pool to ensure the trends in the UK and the control matched before 2021.
For non-EU workers, moving back the treatment time to 2016 allowed us to check whether the EU-15/EEA and the UK had divergent trends in non-EU workers after the 2014-16 ‘migration crisis’. The treatment date set to 2021 may have led the algorithm to select EU-15/EEA countries who did not receive many of these migrants, because Britain received relatively few, owing to its location in Europe. That might bias the counterfactual because the algorithm selects countries that have weaker attractiveness to non-EU workers in general, not just asylum-seekers, and less propensity to allow them to immigrate and work, compared to the UK. After the migration crisis subsided, those countries would have continued to receive fewer non-EU migrants than the UK did. However, starting the treatment period in 2016 leads to a control that has a similar trend to one starting in 2021.
The second check was whether the estimates were robust when countries were removed from the donor pool, thereby forcing the algorithm to find matches on other countries than the ones chosen in the full pool. If the paths of the controls are very different, that suggests particular countries are unduly driving the estimates, and we cannot be confident that other factors than Brexit are not driving the results.
We randomly dropped 50 per cent of the countries from the donor pool, ran the SDID procedure, then did the same thing with 40 per cent , 30 per cent , 20 per cent and 10 per cent of countries dropped. We then repeated that whole exercise five times, so that we ended with 26 controls (including our original estimates). The shaded areas on the charts represent the 5th and 95th percentiles of those 26 controls. Since they are not widely divergent, we can be confident our results are robust.
Country weights for the two controls are shown below.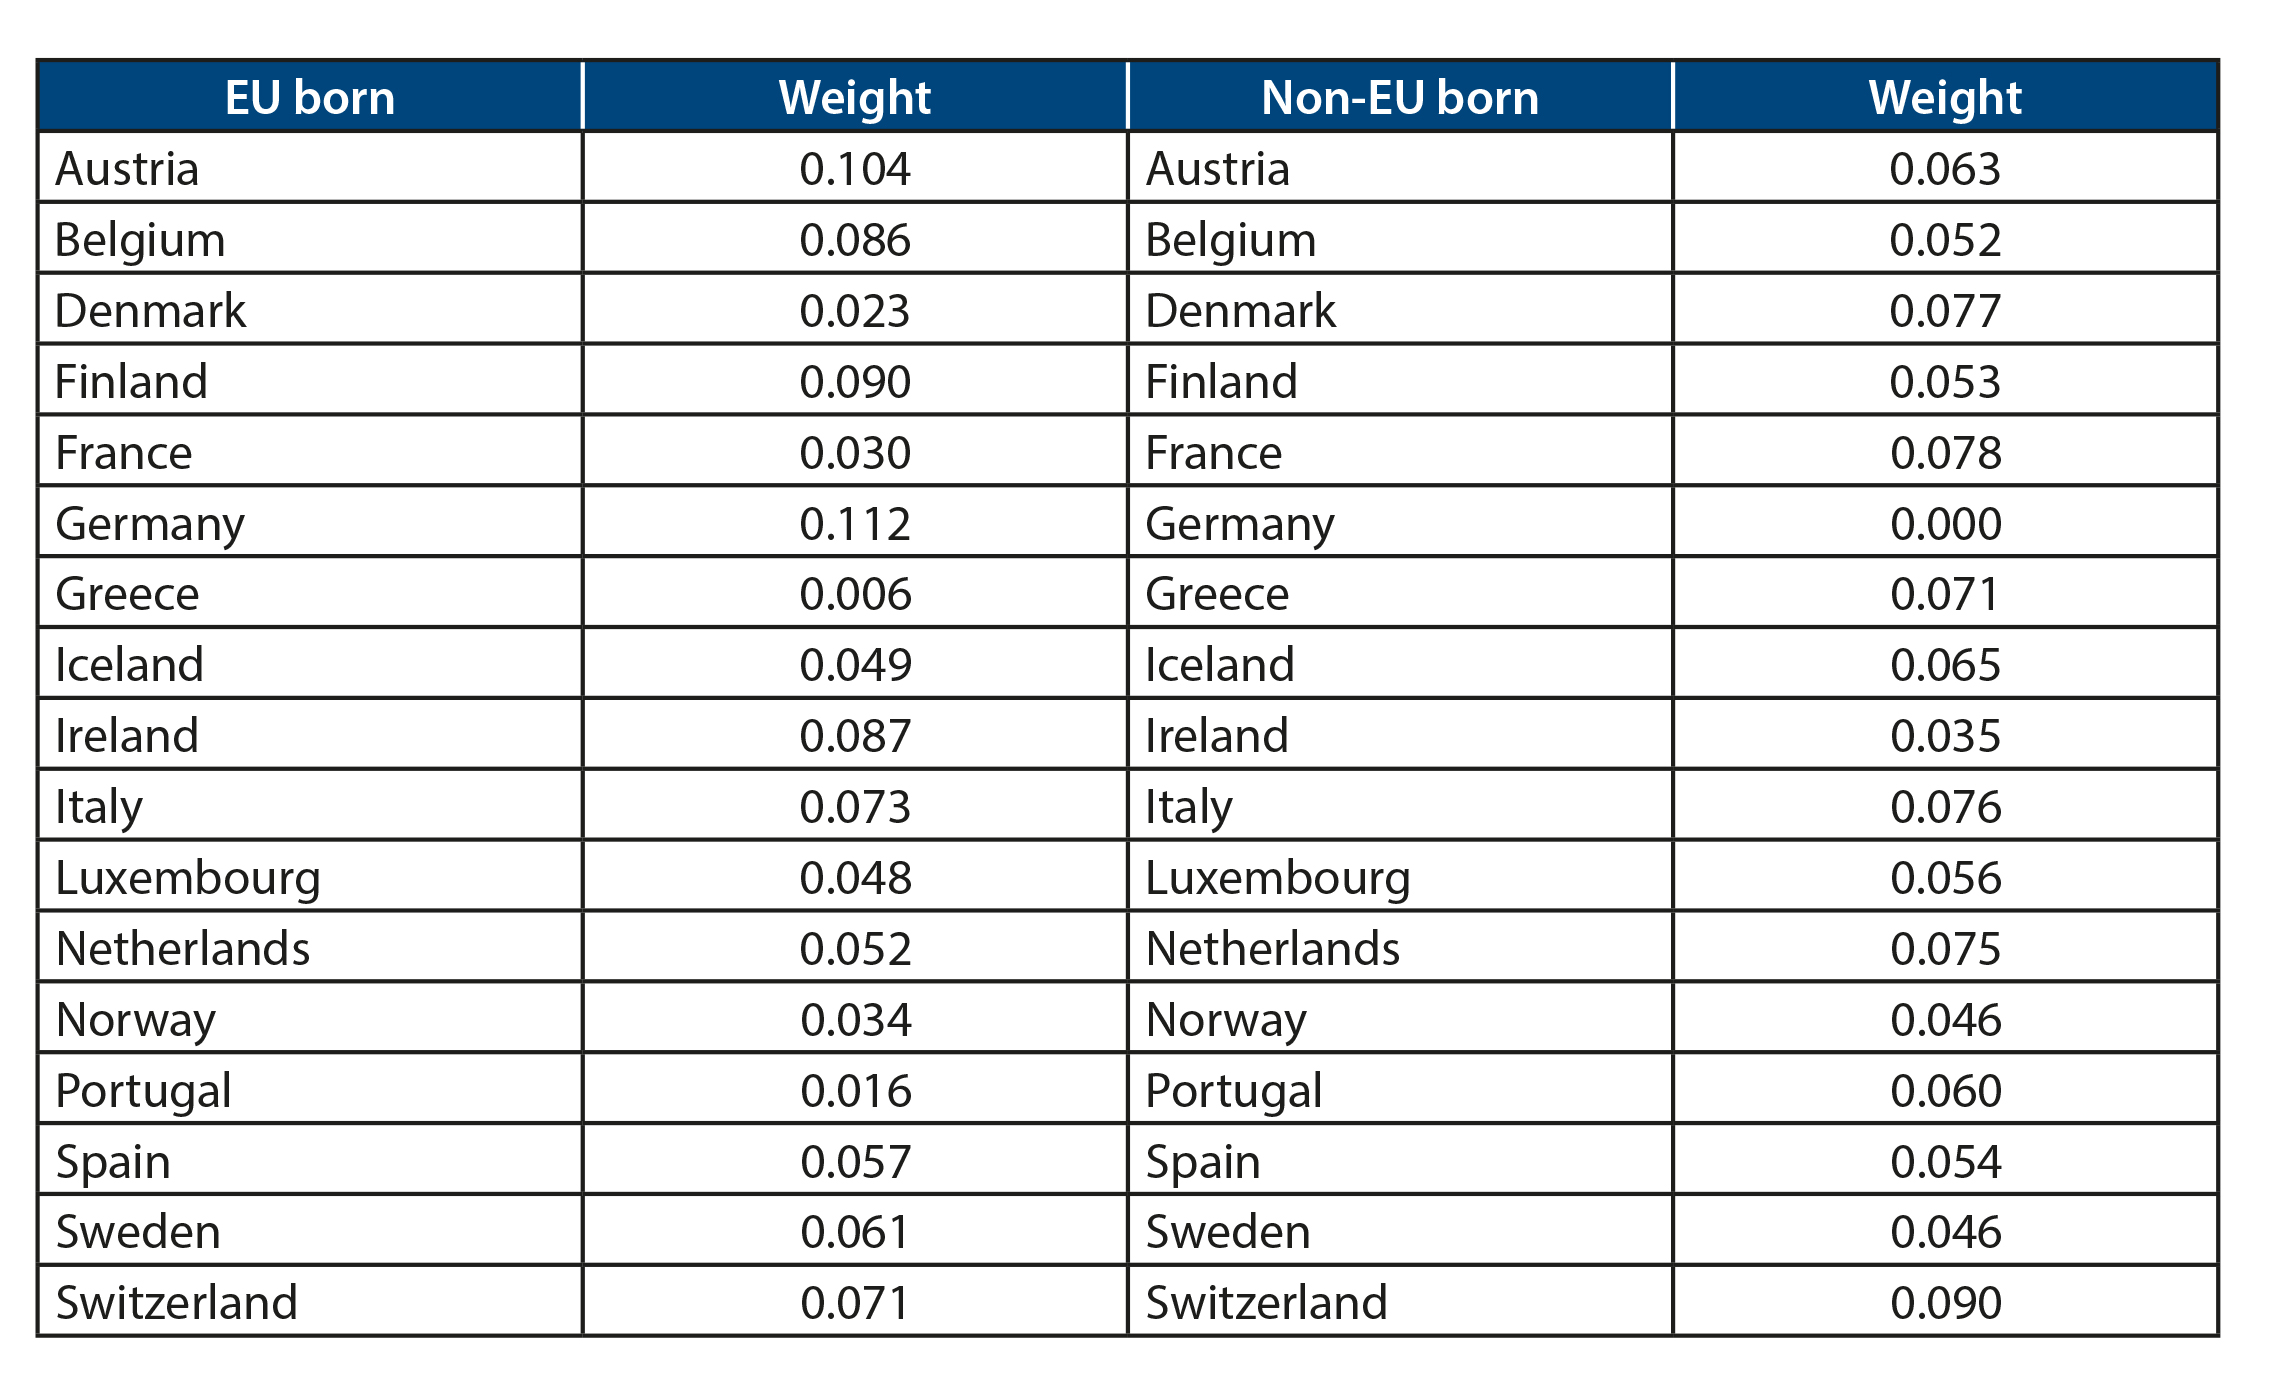
Input data for the models are available here, and Stata code here.
Jonathan Portes is Professor of Economics and Public Policy at King’s College London and a senior fellow at UK in a Changing Europe, and John Springford is an associate fellow at the Centre for European Reform.
View press release
Add new comment